
Special Council Meeting
Minutes
Wednesday 25 June 2014
Commencing at 5.00pm
Nandaly Community Hall
5 Messines Street
Nandaly
John Hicks
Acting Chief Executive Officer
Buloke Shire Council
Special Council Meeting
Minutes
Wednesday 25 June 2014
Commencing at 5.00pm
Nandaly Community Hall
5 Messines Street
Nandaly
John Hicks
Acting Chief Executive Officer
Buloke Shire Council
Minutes of the Special Meeting held on Wednesday, 25 June 2014 commencing at 5.00pm in the Nandaly Community Hall, 5 Messines Street, Nandaly
PRESENT
CHAIRPERSON:
Cr Reid Mather Mallee Ward
COUNCILLORS:
Cr Ellen White Mallee Ward
Cr David Pollard Lower Avoca Ward
Cr Stuart McLean Lower Avoca Ward
Cr Graeme Milne Mount Jeffcott Ward
Cr Leo Tellefson Mount Jeffcott Ward
Cr Gail Sharp Mount Jeffcott Ward
OFFICERS:
Mr John Hicks Acting Chief Executive Officer
Ms Gaynor Doreian Director Corporate and Community Services
Mr Anthony Judd Director Works and Technical Services
Mr Tom O’Reilly Manager Finance
AGENDA
1. COUNCIL prayer AND WELCOME
The Mayor Cr Reid Mather read the Council Prayer and welcomed members of the gallery.
We acknowledge the traditional owners of the land on which we are meeting. We pay our respects to their Elders and to the Elders from other communities who maybe here today.
2. RECEIPT OF APOLOGIES
Nil.
3. REQUESTS FOR LEAVE OF ABSENCE
Nil.
4. DECLARATION of PECUNIARY AND conflictS of interest
There were no declarations of interest.
|
Council resolve to amend the Order of Business for this Special Meeting 25 June 2014, in order to consider a Late Report, Petition in Regard to the Buloke Shire Council Budget 2014 – 2015, to be addressed prior to considering Item 5.1.
Seconded: Cr David Pollard Carried. |
Petition in regard to Buloke Shire Council Budget 2014-15
5.1 Adoption of Budget for Municipal Year Ending 30 June 2015
NEXT MEETING
The next Ordinary Meeting of Council will be held in Wycheproof Supper Room, 367 Broadway, Wycheproof on Wednesday, 9 July 2014 at 7.00pm.
JOHN HICKS
ACTING CHIEF EXECUTIVE OFFICER
5. Item
Petition in regard to Buloke Shire Council Budget 2014-15
Author’s Title: Acting Chief Executive Officer
Department: Office of the CEO File No: FM/05/02
|
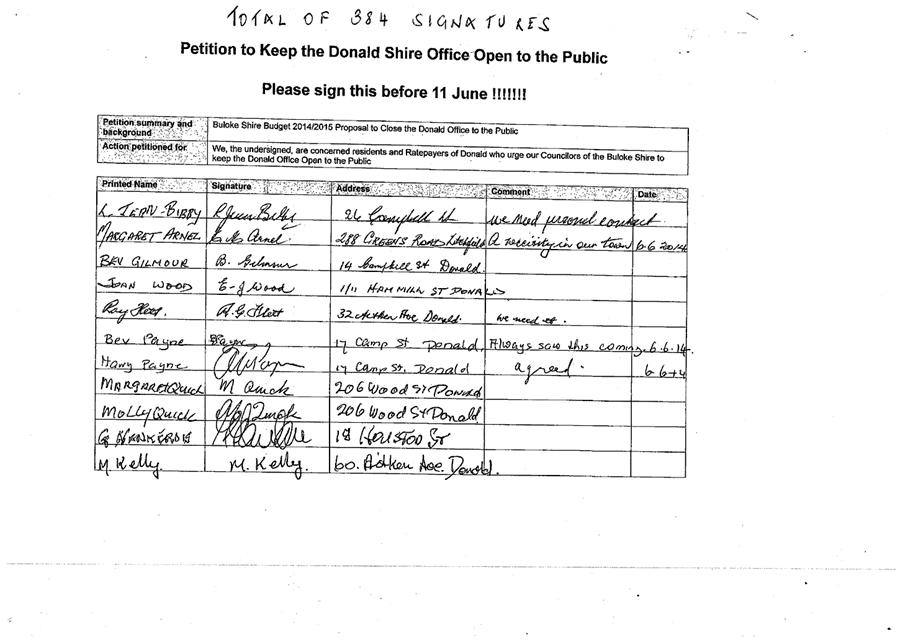
1 ViewPetition - Keep the Donald Shire Office Open to the Public |
Relevance to Council Plan 2013 - 2017
Objective: An organisation that is responsibly governed with a strong emphasis on sustainable financial and risk management.
Strategy: Ensuring Council is well governed and its finances and risks are managed sustainably and responsibly.
Priority: Review and renew the Council’s financial plans to improve financial sustainability as measured by indicators of local government financial sustainability developed by the Victorian Auditor-General’s Office.
|
That Council consider the petition requesting Council “keep the Donald office open to the public” received at the last Special Meeting of 18 June 2014 as part of its decisions on the 2014-2015 Draft Budget.
Seconded: Cr Leo Tellefson Carried. |
1. Executive Summary
A Petition supported by 384 signatures was received by Council on 11 June 2014. The petition referenced the Buloke Shire Budget 2014/2015, requested “Council keep the Donald Office open to the public” and was tabled at the 18 June 2014 Council Special Meeting.
2. Discussion
The petition arose at the same time as Council exhibited its draft budget for public comment. The draft budget advocates the closure of face-to-face customer services at four Council offices including Donald.
3. Financial Implications
In the draft budget the closure of face-to-face customer services at four Council offices is expected to realise a cost saving in 2015-2016 of $380,000.
4. Community Consultation
Community Consultation on the draft budget was undertaken at 10 Town meetings and with submissions received at last week’s Special Council Meeting.
5. Internal Consultation
Extensive internal consultation was undertaken in the preparation of the draft budget including a Service Review to identify cost savings.
6. Legislative/ Policy Implications
Nil.
7. Environmental Sustainability
Nil.
8. Conflict of Interest Considerations
There are no conflict of interest considerations associated with this report.
9. Conclusion
Council can consider the petition as part of its decisions on the 2014-2015 draft budget.
Buloke Shire Council Special Meeting Minutes Wednesday, 25 June 2014
Petition in regard to Buloke Shire Council Budget 2014-15
Attachment 1 Petition - Keep the Donald Shire Office Open to the Public
5.1 Adoption of Budget for Municipal Year Ending 30 June 2015
Author’s Title: Acting Manager Finance
Department: Finance File No: Bud1
|
1 ViewDraft 2014-15 Budget for Adoption |
Relevance to Council Plan 2013 - 2017
Objective: An organisation that is responsibly governed with a strong emphasis on sustainable financial and risk management.
Strategy: Ensuring Council is well governed and its finances and risks are managed sustainably and responsibly.
Priority: Review and renew the Council’s financial plans to improve financial sustainability as measured by indicators of local government financial sustainability developed by the Victorian Auditor-General’s Office.
|
That Council having considered all submissions received in accordance with Section 223 of the Local Government Act 1989 (the Act) and having complied with the requirements of the Act: 1. Adopts the amended 2014/15 Proposed Budget as the final Adopted Annual Budget of Council for the 2014/15 financial year 2. Authorises the Acting Chief Executive Officer to give public notice of the decision to adopt the Annual Budget and submit a copy to the Minister for Local Government, in accordance with Section 130 of the Act 3. Notifies in writing the persons who have made submissions in accordance with Section 223 of the Act, of the Council’s decision 4. A general rate be declared for the period commencing on 1 July 2014 and concluding on 30 June 2015 5. Declare that the general rate be raised by the application of differential rates 6. Declare a total amount of $11,453,120 as the amount Council intends to raise by General Rates and annual Service Charges, which is calculated as follows: · Section 158:General Rates $9,514,000 · Section 159:Municipal Charge $657,000 · Section 158:Kerbside Garbage & Recycling Collection Annual Service Charge $1,282,120 7. Declare the Municipal Charge for 2014/15 at $150 for each rateable assessment in respect of which a Municipal Charge may be levied 8. Declare the annual Service Charge for Kerbside Garbage & Recycling Collection at $380 9. Provide for an early full rate payment discount of 1.5% on rates and charges to be granted, if full payment (including any arrears and interest) is received on or before Friday 26 September 2014. (The discount to exclude the Fire Services Property Levy). 10. Make copies of the 2014/15 Adopted Budget available at Council offices and on the Council website.
Seconded: Cr Stuart McLean AMENDED MOTION PUT:
The closure of customer service at offices, except for Wycheproof, be removed from the budget and other processes be considered to make the savings.
Moved: Cr LEO TELLEFSON
Seconded: Cr GAIL SHARP
Cr Milne declared a Conflict of Interest.
Cr Milne left the Council Chamber at 5.33pm.
AMENDED MOTION PUT AMENDED MOTION - lost.
Cr Milne returned to the Council Chamber at 5.39pm.
The original motion was then put and carried
Cr Milne requested a division.
Cr Reid Mather - FOR Cr Ellen White - FOR Cr David Pollard - FOR Cr Stuart McLean - FOR Cr Graeme Milne - AGAINST Cr Leo Tellefson - FOR Cr Gail Sharp - FOR
|
1. Executive Summary
In relation to the 2014/15 Proposed Budget, Council having considered public submissions and other information contained in this report must resolve whether to:
a) adopt the 2014/15 Budget following public notice and inspection in accordance with the Act and
b) declare the amount which the Council intends to raise by rates and charges
This report recommends that Council adopt the amended 2014/15 Proposed Budget attached to this report, as the final Adopted Annual Budget of Council for the 2014/15 financial year.
2. Discussion
Under the provisions of the Act, Council is required to prepare and adopt an annual budget for each financial year. The budget is required to include certain information about the rates and charges the council intends to levy, as well as a range of other information required by the regulations which support the Act e.g. the capital works program to be undertaken and the human resources required.
Importantly, the Budget document contains detailed financial performance indicators which provide a useful analysis of the Council’s financial position and performance.
3. Revisions to the Proposed Budget
Following the presentation of the Proposed Budget at the Ordinary Council meeting of 14 May 2014, the Council has become aware of new information which impacts on the Budget. This new information has been incorporated into the Proposed Budget resulting in the following amendments:
a) Federal Budget Changes:
· The Commonwealth Government intends to pause the indexation of the financial assistance grants for the three years to the end of 2016/17. This impact has resulted in a total combined loss of $579,849 of grants income being removed from the Proposed Budget for the years 2014/15 to 2017/18.
· The Commonwealth Government has indicated that it does not intend to bring forward any advance payments as has occurred in previous years. The impact has resulted in $1,322,431 of grants income being removed from the 2013/14 Forecast Actual.
b) Capital Works Carried Forward From 2013/14
· The Proposed Budget has been amended to reflect the capital works program carried forwards expenditure from 2013/14, increasing from $1,027,600 to $1,883,600 due to timing delays in finalising projects before 30 June 2014. These projects have already commenced and will now be completed in the 2014/15 financial year.
c) Sundry Debtor Flood Works Income
· The Proposed Budget provided for an estimated $800,000 of income resulting from Council staff undertaking flood recovery road work repairs on behalf of the external contractor for the flood recovery works. The total forecast income for 2013/14 has been revised down by $100,000.
d) Flood Grants Income
· Council has been advised to expect receipt of an additional $400,000 of Capital Flood Grants monies before 30 June 2014. The Proposed Budget has been amended to reflect this timing difference with the Forecast Actual 2013/14 being increased by $400,000 and the 2014/15 Budget decreased by the same amount; overall a neutral impact.
e) Loan Borrowings
· The Budget provides for an interest only loan of $7M over 5 years. Advice has recently been received advising the indicative loan interest rate will be 4.8% fixed. This positive reduction in the indicative loan interest rate reflects an additional saving of $20,000 per annum in the 2014/15 Budget and Forecast years.
4. Financial Implications
The annual budget adoption process is a formal process required under Section 127 (1) of the Act and includes the current and future financial implications of Council’s operations and capital expenditure requirements. The adopted 2014/15 Budget will provide an overarching financial framework for the Council to implement for the forthcoming year.
5. Community Consultation
The Proposed Budget was presented at the Ordinary Council meeting of Wednesday 14th May 2014. The Proposed Budget was then publicly advertised in the Melbourne Age and three local newspapers seeking submissions from interested parties in accordance with Section 223 of the Act.
The Proposed Budget was available for inspection at the five Council district offices and also on the Council’s website www.buloke.vic.gov.au .
Public Budget Information sessions were held in ten (10) Shire of Buloke townships on 26 May and 27 May 2014.
All written submissions (nine in total including a petition with 384 signatures) received in accordance with Section 223 of the Act, were received at a Special Council meeting held on Wednesday 18th June 2014. Several interested parties took the opportunity to provide a verbal presentation to their submission at the meeting for further Council consideration.
6. Internal Consultation
The Budget has been prepared by the Acting Finance Manager with extensive input from Councillors, the Senior Management team and Budget Managers.
7. Legislative / Policy Implications
Council has a statutory responsibility to prepare and adopt a Budget In accordance with the Local Government Act 1989 and Local Government (Planning and Reporting) Regulations 2014.
The Council must adopt its budget and forward a copy to the Minister for Local Government by 31 August 2014.
8. Environmental Sustainability
There are no environmental considerations arising from this report.
9. Conflict of Interest Considerations
Section 79C(2) of the Local Government Act indicates that if a budget or revised budget to be approved by Council includes funding for a matter of which a Councillor has a Conflict of Interest, the Councillor is taken not to have a Conflict of Interest for the purposes of approving the budget or revised budget if:
- The Council approved the matter and proposed funding previously; and
- The Councillor disclosed the nature of the Conflict of Interest when the decision in respect of the funding was originally considered and made.
10. Conclusion
Council has complied with all of the relevant requirements of the Local Government Act 1989 relating to the preparation, presentation and adoption of the 2014/15 Budget.
Buloke Shire Council Special Meeting Minutes Wednesday, 25 June 2014
5.1.1 Adoption of Budget for Municipal Year Ending 30 June 2015
Attachment 1 Draft 2014-15 Budget for Adoption

DRAFT
BULOKE SHIRE COUNCIL
Annual Budget
2014 – 2015
Presented to Council on 25th June 2014 for adoption
Buloke Shire Council Special Meeting Wednesday, 25 June 2014
5.1.1 Adoption of Budget for Municipal Year Ending 30 June 2015
Attachment 1 Draft 2014-15 Budget for Adoption
|
Contents |
Page |
|
|
|
|
Mayor’s introduction |
3 |
|
Chief Executive Officer’s summary |
5 |
|
Budget processes |
8 |
|
Overview |
|
|
1. Linkage to the Council Plan |
9 |
|
2. Services, initiatives and service performance indicators |
12 |
|
3. Budget influences |
23 |
|
Budget analysis |
|
|
26 |
|
|
33 |
|
|
36 |
|
|
39 |
|
|
Long term strategies |
|
|
8. Strategic resource plan and financial performance indicators |
41 |
|
45 |
|
|
10. Other Strategies |
48 |
|
Appendices |
|
|
51 |
|
|
B Rates and charges |
58 |
|
63 |
|
|
D Fees and charges schedule |
69 |
|
E Service Review Outcomes |
79 |
Buloke Shire Council Special Meeting Wednesday, 25 June 2014
5.1.1 Adoption of Budget for Municipal Year Ending 30 June 2015
Attachment 1 Draft 2014-15 Budget for Adoption
Mayor’s introduction
It gives me great pleasure to present this Budget to the community of Buloke.
The budget sets a new direction for Buloke Shire Council and puts the framework together to secure the long term sustainability of the Shire.
The Buloke Community and Council have been rebuilding the community assets after the devastating floods in 2010 and 2011. This has seen over $42 million spent on our road network alone with these works being completed in June 2014. Council’s emphasis now needs to be on securing long term financial sustainability.
To this end, Council has considered all of the services that are provided and recognise that strategic decisions on service provision are required to have an impact on financial sustainability. In reviewing services particular emphasis has been based around continuing to support community groups who provide valuable support and services to the community.
These groups rely on extensive volunteer support and are often the life blood of small communities. This budget continues to support these groups and removes much of the red tape for these organisations by committing to funding support without the need for an extensive application process. Council has also considered services that have previously received external funding and these services have been reduced to reflect current funding allocations.
The 2014/15 Budget proposes direct operating expenditure reduction of $1.3 million and foreshadows further ongoing reductions of $3.4 million annually. We will increase rates by 6.0 percent in the 2014/15 financial year and the kerbside garbage and recycling service charge will increase to $380 per service to ensure full cost recovery for the service provided. The Budget proposes a borrowing program of $7.0mill in the 2014/15 financial year and a total Capital Works program of $7.78 million, with Council substantially relying on Grant Funds to deliver the program.
To achieve these reductions in operating expenditure Council will need to change service levels. It is recognised that changes in service provision will take time to implement. Further consultation with Staff and the Community is required to ensure the changes are implemented in a manner which minimises the impacts and Council is able to continue its service delivery obligations.
It is further recognised that additional savings are required and Council has requested management to continue to find improvements and efficiencies in services across all areas of Council’s operations.
The key initiatives in the Budget are:
· Funding for three key flood mitigation projects that were prioritised out of the Charlton and Donald Flood and Drainage Management Plans. This includes $225,000 to develop full functional plans, specifications and costings for the Charlton town ring levee bank. $500,000 for increasing the size of the culverts over Gower Creek on the Charlton-St Arnaud Road. For Donald, $925,500 has been allocated for the construction of levee banks along the existing Donald Walking Track in Byrne Street and for the extension of the existing levee bank at the Goodwin Village.
· Rationalisation of the community support program which requires youth and economic development to target government funded programs. This will maximise Council’s ability to secure funding to the community from external sources and minimise the cost to our community.
· Rationalisation of the Customer Service provision by increasing access for all financial transactions at Post Office outlets and closing the public access at four of Council’s District Offices.
· Improvement to Community Halls with a range of upgrade works to kitchens, heating and cooling. Council will also improve the community access to our Halls by removing the fees charged to community groups.
· Injection of $214,000 into support for recreation reserves across the Shire. This will provide Recreation Maintenance Allocations to 9 townships, provided direct to the local communities.
· Continued development and improvements to Council’s 7 swimming pools, with an additional $106,000 of funding for upgrade works.
· Rationalisation of our work crews with a reduction in grader fleet from 6 to 4 combined with a program to upgrade and modernise Council’s outdoor plant fleet.
· Continued renewal of our road network with over $1.35mill investment in reseals and resheets on roads across the Shire.
· Implementation of the Street Light Sustainability Upgrade program which will see Council’s street lights converted to LED technology. This will not only reduce Council’s carbon footprint but will see a long term cost saving to the community.
· Continued support of Council’s saleyards with a program to upgrade ramps and improvements to fencing.
· Rationalisation of our community grants program to reduce the administrative burden on local community groups. Community groups will now be directly funded from the budget, removing the need for an extensive administrative process. The program includes support for Senior Citizens’ Christmas Lunches and administrative support to Township Forums.
· Council will continue to support the Loddon Murray Leadership Program which provides an avenue for emerging community leaders to access a valuable opportunity to develop skills that can be injected back into the local area.
Cr Reid Mather
Mayor
Buloke Shire Council Special Meeting Wednesday, 25 June 2014
5.1.1 Adoption of Budget for Municipal Year Ending 30 June 2015
Attachment 1 Draft 2014-15 Budget for Adoption
Chief Executive Officer’s summary
Council has prepared a Budget for the 2014/15 financial year which seeks to balance the demand for services and infrastructure with the need to secure the long term financial sustainability for Council. Key budget information is provided below about the rate increase, operating result, services, cash and investments, capital works, financial position, financial sustainability and strategic objectives of the Council.
1. Rates
A = Actual F = Forecast B = Budget SRP = Strategic Resource Plan estimates
It is proposed that general rates increase by 6.0% for the 2014/15 year, raising total rates and charges of $11.45 million. This rate increase is in line with the level foreshadowed in Council’s Strategic Resource Plan adopted in the previous year. (The rate increase for the 2013/14 year was 6.0%)
2. Operating result
The expected operating result for the 2014/15 year is a surplus of $0.9 million, which is a decrease over 2013/14. The 2013/14 result was significantly impacted by flood recovery grants. The adjusted underlying result, which excludes items such as non-recurrent capital grants and non-cash contributions is a deficit of $5.1million, which is an improved position over 2013/14 Budget from a deficit of $9.1million – refer to point 6 of this summary for further information.
3. Cash position
Council’s cash position is budgeted to increase by $4.1 million resulting in a positive cash position at 30 June 2015 of $0.01 million. This is due to the $7 million loan provided for in the 2014/15 budget and reduction in capital spend. The improvement in the cash position is expected to improve over time thus providing funds for future works and services and repayment of loan borrowings.
4. Capital works
The capital works program for the 2014/15 year is expected to be $7.78 million of which $1.88 million relates to projects which will be carried forward from the 2013/14 year. The carried forward component is fully funded from the 2013/14 budget. Of the $7.8 million of capital funding required, $6.1 million will come from external grants with the balance from Council cash. The capital expenditure program has reduced to reflect the funds available from operating activities and relies heavily on grant funding in the medium term.
Asset renewal forms over 55% of the capital program, with investment in new assets being significantly influenced by development of flood related infrastructure ($1.65 million).
5. Financial position (working capital)
The financial position is expected to improve with net assets (net worth) to increase by $0.95 million to $169.64 million. Net current assets (working capital) will improve by $7.40 million to negative $3.34 million as at 30 June 2015. This is mainly due to a large invoice for floodworks of $2.8 million forecast to be paid in July, reducing Current Liabilities, combined with the effects of the new $7 million loan facility allowing cash holdings to finish at a positive $0.01 million.
6. Financial sustainability (adjusted underlying result)
A high level Strategic Resource Plan for the years 2014/15 to 2017/18 has been developed to assist Council in adopting a budget within a longer term prudent financial framework. The key objective of the Plan is financial sustainability in the medium to long term. The adjusted underlying result, which is a measure of financial sustainability, shows a decreasing deficit over the four year period.
John Hicks
Chief Executive Officer (Acting)
Buloke Shire Council Special Meeting Wednesday, 25 June 2014
5.1.1 Adoption of Budget for Municipal Year Ending 30 June 2015
Attachment 1 Draft 2014-15 Budget for Adoption
Budget processes
This section lists the budget processes to be undertaken in order to adopt the Budget in accordance with the Local Government Act 1989 (the Act) and Local Government (Planning and Reporting) Regulations 2014 (the Regulations).
Under the Act, Council is required to prepare and adopt an annual budget for each financial year. The budget is required to include certain information about the rates and charges that Council intends to levy as well as a range of other information required by the Regulations which support the Act.
The 2014/15 Budget, which is included in this report, is for the year 1 July 2014 to 30 June 2015 and is prepared in accordance with the Act and Regulations. The Budget includes financial statements being; a budgeted Comprehensive Income Statement, Balance Sheet, Statement of Changes in Equity, Statement of Cash Flows and Statement of Capital Works. These statements have been prepared for the year ended 30 June 2015 in accordance with the Act and Regulations, and consistent with the annual financial statements which are prepared in accordance with Australian Accounting Standards. The Budget also includes information about the rates and charges to be levied, the capital works program to be undertaken, the human resources required, and other financial information Council requires in order to make an informed decision about the adoption of the Budget.
In advance of preparing the Budget, Officers firstly review and update Council's long term financial projections. Financial projections for at least four years are ultimately included in Council's Strategic Resource Plan, which is the key medium-term financial plan produced by Council on a rolling basis. The preparation of the Budget, within this broader context, begins with Officers preparing the operating and capital components of the annual budget during January and February. A draft consolidated budget is then prepared and various iterations are considered by Council at informal briefings during March and April. A ‘proposed’ budget is prepared in accordance with the Act and submitted to Council in May for approval ’in principle’. Council is then required to give ’public notice’ that it intends to ’adopt’ the Budget. It must give 28 days notice of its intention to adopt the proposed budget and make the Budget available for inspection at its offices and on its internet web site. A person has a right to make a submission on any proposal contained in the budget and any submission must be considered before adoption of the budget by Council.
To assist interested persons to understand the Budget and make a submission if they wish, Council officers undertake a community engagement process including public information sessions, focus groups and other techniques. The final step is for Council to adopt the budget after receiving and considering any submissions from interested parties. The Budget is required to be adopted by 31 August 2014 and a copy submitted to the Minister within 28 days after adoption. The key dates for the 2014/15 Budget process are summarised below:
|
Budget process |
Timing |
|
1. Officers update Council's long term financial projections |
Dec/Jan |
|
2. Officers prepare operating and capital budgets |
Jan/Feb |
|
3. Councillors consider draft budgets at informal briefings |
Mar/Apr |
|
4. Proposed budget submitted to Council for approval |
May |
|
5. Public notice advising intention to adopt budget |
May |
|
6. Budget available for public inspection and comment |
May |
|
7. Public submission process undertaken |
May/Jun |
|
8. Submissions period closes (28 days) |
Jun |
|
9. Submissions considered by Council/Committee |
Jun |
|
10. Budget and submissions presented to Council for adoption |
Jun |
|
11. Copy of adopted budget submitted to the Minister |
Jun/Jul |
|
12. Revised budget where a material change has arisen |
Sep-Jun |
1. Linkage to the Council Plan
This section describes how the Annual Budget links to the achievement of the Council Plan within an overall planning framework. This framework guides the Council in identifying community needs and aspirations over the long term, medium term (Council Plan) and short term (Annual Budget) and then holding itself accountable (Audited Annual Statements).
1.1 Planning and accountability framework
The Strategic Resource Plan, included in the Council Plan, is a rolling four year plan that outlines the financial and non-financial resources that Council requires to achieve the strategic objectives described in the Council Plan. The Annual Budget is framed within the Strategic Resource Plan, taking into account the services and initiatives included in the Annual Budget which contribute to achieving the strategic objectives specified in the Council Plan. The diagram below depicts the planning and accountability framework that applies to local government in Victoria.
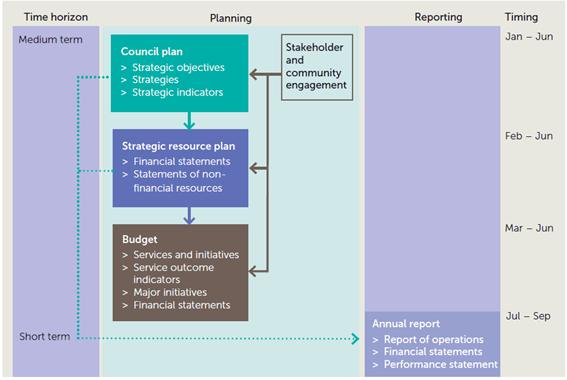
Source: Department of Transport, Planning and Local Infrastructure
The timing of each component of the planning framework is critical to the successful achievement of the planned outcomes. The Council Plan, including the Strategic Resource Plan, is required to be completed by 30 June following a general election and is reviewed each year in advance of the commencement of the Annual Budget process.
1.2 Our purpose
Our Vision:
Our vision is a sustainable community where everyone participates to enrich the cultural, social and economic viability of the Shire and cares for the natural environment.
Our mission
Our mission is to ensure the community has the practical tools to make Buloke an amazing place to live. We do this by:
· Providing a range of needed services.
· Engaging with the community to understand emerging needs.
· Advocating on behalf of the community for services to meet needs.
· Good governance and sound financial and risk management practices.
· Involving the community in making decisions that affect them directly and indirectly.
· Celebrating community achievements and milestones together.
Our values
Accountability for the Future
Creating the Future
Financial Sustainability
Asset-Based Approaches
Interconnected and Interdependent
Always Practical
Service Principles
1.3 Strategic objectives
Council delivers services and initiatives under 24 major service categories. Each contributes to the achievement of one of the five Strategic Objectives as set out in the Council Plan for the years 2013-17. The following table lists the five Strategic Objectives as described in the Council Plan.
|
Strategic Objective |
Description |
|
1. Our Community |
A Buloke community where people of all ages, backgrounds and abilities are embraced and supported and can access the Council services they need to live healthy and fulfilling lives. A Buloke community connected and involved in shaping decisions that affect them. |
|
2. Our Local Economy |
A local economy in which the contribution of the agricultural sector and business sector is recognised and their continued growth actively encouraged and supported. A local economy in which new business is actively encouraged; investment welcomed; employment created; business skills developed and local networks are supported. |
|
3. Our Built Environment |
A Shire planned to meet the current and future needs of the agricultural sector while maintaining and enhancing its natural environment. A Shire where roads, drains, public spaces, community facilities, parks and other essential infrastructure are fit for purpose, well maintained and contribute to the well-being of the community. |
|
Strategic Objective |
Description |
|
4. Our Natural Environment |
A Shire working with the community to reduce our carbon footprint, protect and enhance the natural environment and share experiences and information. |
|
5. Our People and Organisation |
An organisation that is responsive to the evolving needs of the community. An organisation that is responsibly governed with a strong emphasis on sustainable financial and risk management. An organisation that values and supports the development of its people and is an employer of choice. An organisation committed to active communication and engagement with our community. |
2. Services, initiatives and service performance indicators
This section provides a description of the services and initiatives to be funded in the Budget for the 2014/15 year and how these will contribute to achieving the strategic objectives specified in the Council Plan as set out in Section 1. It also includes a number of initiatives, and service performance outcome indicators. The Strategic Resource Plan (SRP) is part of and prepared in conjunction with the Council Plan. The relationship between these components of the Budget and the Council Plan, along with the link to reporting in the Annual Report, is shown below.
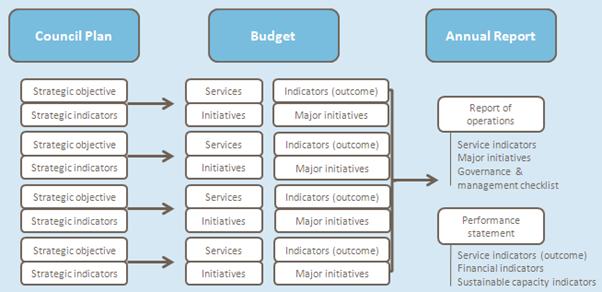
Source: Department of Transport, Planning and Local Infrastructure
2.1 Strategic Objective 1: Our Community
To achieve our objective of Our Community, we will continue to plan, deliver and improve high quality, cost effective, accessible and responsive services. The services, initiatives, major initiatives and service performance indicators for each business area are described below.
Services
|
Service area |
Description of services provided |
Expenditure Net Cost |
|
Aged and Disability Services1)2) |
This service provides a range of maintenance and
support services to assist frail older people and younger people with a
disability to live independently at home. Council's service provides domestic
assistance, personal care, respite care, home maintenance, meals services,
volunteer coordination, aged transport, aged accommodation and senior
citizens centres. |
1,763 (1,161) 602 |
|
Early Years |
This service is to advocate for the wellbeing of
children and their families and ensure it is supported through planning and
service development. The service provides pre-school services in 5 towns,
maternal and child health and support for playgroups run by parents. |
351 (185) 166 |
|
Library Services |
This service provides mobile library services to the townships of Birchip (co-located with Birchip school), Charlton, Donald, Watchem, Berriwillock, Sea Lake, Culgoa, Nullawil and Wycheproof. |
278 (98) 180 |
|
Recreation,3) |
This service provides recreational facilities and support to community run recreation reserves in 9 towns across the Shire, as well as governance support to community recreation clubs and committees. |
315 (0) 315 |
|
Community Grants4) |
This service provides donations, allocations and support to groups in the community that contribute to services that connect and involve the local area. |
73 (0) 73 |
|
Environmental Health |
This
service promotes the health and well-being of the Shire’s local communities
through a range of Public Health Programs including immunisations, food
surveillance and registration of food premises, accommodation standards and
waste water management. |
149 (30) 119 |
Initiatives
1) The cost of Aged and Disability Services are to be capped to current levels with service delivery efficiencies implemented over the 2014/15 financial year. The service efficiencies will deliver a total saving of $150,000 in the 2015/16 financial year and beyond.
2) The current community transport services, which include the taxi subsidy in Wycheproof, volunteer transport and community bus will not be continued when the vehicles are no longer fit for purpose. This will result in $30,000 budget savings in 2015/16.
3) Council will contribute $214,000 into support for recreation reserves across the shire. This will provide Recreation Maintenance Allocations to 9 townships, provided directly to the local communities.
4) Rationalisation of Council’s community grants
program will reduce the administrative burden on local community groups.
Community groups will now be directly funded from the budget. The following
allocations are included in the budget:
|
Buy Local Christmas Promotion |
$3,500 |
|
Senior Citizens’ Christmas Functions |
$3,500 |
|
School Award Nights |
$850 |
|
Township Forum Administrative Support |
$10,000 |
|
Event Sponsorships |
$6,300 |
|
Community Grants Program |
$20,000 |
|
SES Contribution |
$6,500 |
|
Agricultural Shows |
$300 |
|
Australia Day Celebrations |
$5,000 |
|
L2P Funding Charlton College |
$15,000 |
|
Friends of Mt Wycheproof allocation |
$2,000 |
Service Performance Outcome Indicators
|
Service |
Indicator |
Performance Measure |
Computation |
|
Home and Community Care |
Participation
|
Participation in HACC service (Percentage of the municipal target population who receive a HACC service)
|
[Number of people that received a HACC service / Municipal target population for HACC services] x100
|
|
|
|
Participation in HACC service by CALD people (Percentage of the municipal target population in relation to CALD people who receive a HACC service)
|
[Number of CALD people who receive a HACC service / Municipal target population in relation to CALD people for HACC services] x100
|
|
Early Years |
Participation |
Participation in the MCH service (Percentage of children enrolled who participate in the MCH service)
|
[Number of children who attend the MCH service at least once (in the year) / Number of children enrolled in the MCH service] x100
|
|
|
|
Participation in MCH service by Aboriginal children (Percentage of Aboriginal children enrolled who participate in the MCH service)
|
[Number of Aboriginal children who attend the MCH service at least once (in the year) / Number of Aboriginal children enrolled in the MCH service] x100
|
|
Libraries |
Participation |
Active library members (Percentage of the municipal population that are active library members)
|
[Number of active library members / municipal population] x100
|
|
Service |
Indicator |
Performance Measure |
Computation |
|
Food safety
|
Health and Safety |
Critical and major non-compliance notifications (Percentage of critical and major non-compliance notifications that are followed up by Council) |
[Number of critical non-compliance notifications and major non-compliance notifications about a food premises followed up / Number of critical non-compliance notifications and major non-compliance notifications about food premises] x100
|
2.2 Strategic Objective 2: Our Local Economy
To achieve our objective of Our Local Economy, we will continue to plan, deliver and improve high quality, cost effective, accessible and responsive services. The services, initiatives, major initiatives and service performance indicators for each business area are described below.
Services
|
Service area |
Description of services provided |
Expenditure Net Cost |
|
Community Support5) |
The service develops links between and within the communities in the Shire and works with local communities and groups to access community projects recognised as community priorities and provides a range of youth services that support young people aged between 12 and 25. The service also facilitates economic development throughout the Shire and provides support to local businesses and assists in the promotion of tourism.
|
541 (105) 436 |
|
Saleyards,6) |
This service provides for the management and administration of the Council’s Saleyards Precinct at Wycheproof for external Livestock Agents to sell Livestock. |
98 (95) 3 |
|
Corporate Support7) |
This service provides donations, allocations and support to groups that will assists council to facilitate an environment that is conducive to a sustainable and growing local business sector and provides opportunities for local residents to improve their skill levels and access employment.
|
65 (0) 65 |
Initiatives
5) Council’s Community Services has previously been partly funded from drought and flood recovery funding and from the Uniting Church. These funding sources are no longer available. Rationalisation of the Community Support Program, which includes youth and economic development, to Council funding of 1.5 EFT is aimed at targeting government funded programs. This will maximise Council’s ability to secure funding to the community from external sources and minimise the cost to our community. Budget savings in the 2014/15 year are $90,000 with further savings projected in 2015/16 of $230,000.
6) Council’s Capital Budget will include upgrades of the ramps and fencing at the saleyards to ensure continued compliance with safety requirements.
7) The Budget provides for corporate support for
organisations which will enhance economic opportunities and advocate for
community issues. The following allocations are provided for in the budget:
|
Birchip Cropping Group |
$5,000 |
|
Buloke &Northern Grampians Landcare network |
$5,000 |
|
Regional Strategic Plan Stakeholder Contribution |
$1,500 |
|
Wimmera Mallee Tourism |
$5,000 |
|
Rural Councils Victoria |
$2,000 |
|
Municipal Association of Victoria |
$10,000 |
|
STEP Asset Management |
$8,000 |
|
Wimmera Regional Transport Group |
$5,200 |
|
Sunraysia Hwy Committee |
$1,000 |
|
Central Victorian Greenhouse Alliance |
$1,100 |
|
Livestock Saleyards Victoria Association |
$1,200 |
|
Alliance of Councils for Freight Development |
$2,000 |
|
Rate Free Program (phase out) |
$4,000 |
|
Loddon Murray Leadership Program |
$7,000 |
|
Central Murray Regional Transport Forum |
$3,000 |
Service Performance Outcome Indicators
|
Service |
Indicator |
Performance Measure |
Computation |
|
Economic Development
|
Economic activity |
Change in number of businesses (Percentage change in the number of businesses with an ABN in the municipality)
|
[Number of businesses with an ABN in the municipality at the end of the financial year less the number of businesses at the start of the financial year / Number of businesses with an ABN in the municipality at the start of the financial year] x100
|
2.3 Strategic Objective 3: Our Built Environment
To achieve our objective of Our Built Environment, we will continue to plan, deliver and improve high quality, cost effective, accessible and responsive services. The services, initiatives, major initiatives and service performance indicators for each business area are described below.
Services
|
Service area |
Description of services provided |
Expenditure Net Cost |
|
Assets & Project Management |
This service is to provide for the management, design and administration of Council's assets and infrastructure services, including planning and management of the capital works program.
|
160 (50) 110 |
|
Property Maintenance8) |
This service is to provide Property Maintenance Services to a range of Council's building-based assets, focussing on the upkeep and renewal of buildings. |
999 (47) 952 |
|
Road Services9)10) |
This service is to provide road maintenance for the 1100km of Sealed, 650km of Gravel and 3,800km of Earth roads across the Shire. |
8,194 (2,233) 5,961 |
|
Swimming Pools11) |
This service manages and operates seven seasonal swimming pools, from the third week in November to the third week in March, annually. |
676 (0) 676 |
|
Urban Areas12) |
This service manages and coordinates Council’s Parks
& Gardens, Urban Infrastructure & Aerodromes providing routine,
preventative and on-going maintenance and improvements. |
2,755 (3) 2,752 |
|
Statutory Compliance13) |
The purpose of the Statutory and Compliance Service is to provide Statutory Planning, Building Services and Compliance and Local Laws services. |
683 (224) 459 |
Initiatives
8) Improvement to Community Halls with a range of upgrade works to kitchens, heating and cooling. Council will also improve the community access to our Halls by removing the fees charged to community groups.
9) Rationalisation of our work crews with a reduction in grader crews from 6 to 4 combined with a program to upgrade and modernise Council’s outdoor plant fleet. This will be phased in over the 2014/15 financial year with budget savings in the 2015/16 year projected to be $970,000.
10) The Budget provides for the implementation of Council’s Road Management Plan which, with new road classifications, reduces Council’s long term costs and the roads depreciation reduction of $556,000.
11) Continued delivery of seasonal swimming pools in 7 townships. Council to seek further partnerships with community groups to increase the accessibility to community pools.
12) Rationalisation of resources in Urban Areas in Environment will be phased in over the 2014/15 financial year resulting in a 25% reduction in resource levels, delivering a budget saving in 2015/16 of $270,000.
13) Develop a Rural Land Use Strategy for the Buloke Planning Scheme that will plan for long term agricultural productivity alongside complimentary uses within rural zones.
Service Performance Outcome Indicators
|
Service |
Indicator |
Performance Measure |
Computation |
|
Aquatic Facilities
|
Utilisation
|
Utilisation of aquatic facilities (Number of visits to aquatic facilities per head of municipal population)
|
Number of visits to aquatic facilities / Municipal population |
|
Statutory planning |
Decision making |
Council planning decisions upheld at VCAT (Percentage of planning application decisions subject to review by VCAT and that were not set aside) |
[Number of VCAT decisions that did not set aside Council’s decision in relation to a planning application / Number of VCAT decisions in relation to planning applications] x100
|
|
Roads
|
Satisfaction
|
Satisfaction with sealed local roads (Community satisfaction rating out of 100 with how Council has performed on the condition of sealed local roads)
|
Community satisfaction rating out of 100 with how Council has performed on the condition of sealed local roads
|
|
Animal Management
|
Health and safety
|
Animal management prosecutions (Number of successful animal management prosecutions) |
Number of successful animal management prosecutions
|
2.4 Strategic Objective 4: Our Natural Environment
To achieve our objective of Our Natural Environment, we will continue to plan, deliver and improve high quality, cost effective, accessible and responsive services. The services, initiatives, major initiatives and service performance indicators for each business area are described below.
Services
|
Service areas |
Description of services provided |
Expenditure Net Cost |
|
Environmental Planning14)15) |
This service manages Council's Environmental Compliance and Sustainability Programs and Services. |
95 (0) 95 |
|
Lakes16) |
This service provides a contribution to the management and development of the Recreational Lakes including Tchum, Green, Wooroonook, Watchem & Folletti Lakes. |
42 (0) 42 |
|
Waste & Environment17) |
Waste and Environment Services is responsible for the maintenance and improvement of Council’s landfills and transfer stations as well as providing a Residential Kerbside Garbage & Recycling service in all towns within the Shire. |
1,416 (1,043) 373 |
Initiatives
14) Implementation of the Street Light Sustainability Upgrade program which will see Council’s street light converted to LED technology. This will not only reduce Council’s carbon footprint but will see a long term cost saving to the community.
15) A review of all Council owned and/or operated gravel pits will be commenced in 2014/15 to ascertain the future planning and operation of these assets.
16) Council will continue to support lakes with cleaning and litter collection. Contribution to water costs will not be included for funding in the 2014/15 budget; however GWM Water will take over subsidising local lake committees of the water cost by over 50% through the new Recreation Contribution Charge. This has reduced the cost of water delivered to lakes from $48 per megalitre to $20 per megalitre.
17) Council will provide for full cost recovery for waste management and street cleaning services, resulting in an improved budget position for 2014/15 of $431,000.
Service Performance Outcome Indicators
|
Service |
Indicator |
Performance Measure |
Computation |
|
Waste collection
|
Waste diversion
|
Kerbside collection waste diverted from landfill (Percentage of garbage, recyclables and green organics collected from kerbside bins that is diverted from landfill)
|
[Weight of recyclables and green organics collected from kerbside bins / Weight of garbage, recyclables and green organics collected from kerbside bins] x100
|
2.5 Strategic Objective 5: Our People and Organisation
To achieve our objective of Our People and Organisiation, we will continue to plan, deliver and improve high quality, cost effective, accessible and responsive services. The services, initiatives, and service performance indicators for each business area are described below.
Services
|
Service areas |
Description of services provided |
Expenditure Net Cost |
|
Customer Services18) |
This service provides for both internal and external customers by resolving the majority of customer enquiries, requests and payments at the first point of contact. |
471 (0) 471 |
|
Governance & Executive Management |
This service provides for Councillors, and Executive Support and associated which provides the overall Governance Services to the Council.
|
897 (0) 897 |
|
Information Management |
This service is to provide the organisation with Records Management Services and Information and Telecommunications Services.
|
1,030 (0) 1,030 |
|
Municipal Emergency Management19) |
This service develops, coordinates and delivers Council’s Municipal Emergency Management Plan and coordination of MECC Centre and associated software.
|
159 (60) 99 |
|
Procurement.20) |
This service reviews and implements all business processes associated with purchasing, contracting and the tendering services and to manage Council's light fleet and community buses.
|
393 (10) 383 |
Initiatives
18) Rationalisation of the Customer Service provision by increasing access for all financial transactions at Post Office outlets and closing the public access at four of Council’s District Offices. This initiative is to be phased in over the 2014/15 financial year resulting in budget savings of $380,000 in the 2015/16 budget.
19) In collaboration with emergency services agencies, Council will complete a full review and implementation of a new Municipal Emergency Management Plan and commence reviews on emergency sub-plans.
20) Improved efficiencies in the provision of procurement services to provide the service with 2.5EFT. This initiative will be phased in over the 2014/15 financial year resulting in budget savings in 2014/15 of $70,000 and total saving in the 2015/16 Budget of $150,000.
|
Service |
Indicator |
Performance Measure |
Computation |
|
Governance
|
Satisfaction |
Satisfaction with Council decisions (Community satisfaction rating out of 100 with how Council has performed in making decisions in the interests of the community)
|
Community satisfaction rating out of 100 with how Council has performed in making decisions in the interests of the community
|
2.6 Performance Statement
The service performance indicators detailed in the preceding pages will be reported on within the Performance Statement which is prepared at the end of the year as required by section 132 of the Act and included in the 2014/15 Annual Report. The Performance Statement will also include reporting on prescribed indicators of financial performance (outlined in section 8) and sustainable capacity, which are not included in this budget report. The full set of prescribed performance indicators are audited each year by the Victorian Auditor General who issues an audit opinion on the Performance Statement. The major initiatives detailed in the preceding pages will be reported in the Annual Report in the form of a statement of progress in the report of operations.
Buloke Shire Council Special Meeting Wednesday, 25 June 2014
5.1.1 Adoption of Budget for Municipal Year Ending 30 June 2015
Attachment 1 Draft 2014-15 Budget for Adoption
3. Budget influences
This section sets out the key budget influences arising from the internal and external environment within which the Council operates.
3.1 Snapshot of Buloke Shire Council
Our Shire
Buloke Shire is located in north-western Victoria, between 210 and 360 kilometres north-west of Melbourne and is bounded by Mildura and Swan Hill Rural Cities in the north, Gannawarra and Loddon Shire in the east, Northern Grampians Shire in the south, and Yarriambiack Shire in the west.
Buloke is a predominantly rural area used largely for agriculture, particularly grain (wheat, oats and barley) production and sheep grazing. The main townships are Birchip, Charlton, Donald, Sea Lake and Wycheproof. Smaller townships include Berriwillock, Culgoa, Nandaly, Nullawil and Watchem.
The Shire encompasses a total land area of approximately 8,000 square kilometres. It is approximately 140 kilometres long and 60 kilometres wide.
Our Community
6,388 people live in 3,282 households in Buloke, making it one of Victoria’s most sparsely populated municipalities. The community of Buloke is made up of 2,035 (31.9%) of people over the age of 60; 2,900 (45.4%) between 18 and 60 years; 1,119 (14.2%) between 5 and 17 years; and 334 (5.3%) between 0 and 4 years.
The Buloke population is stable, with 4,238 residents (66.3%) living in the Shire for at least five years. 652 residents (10.2%) moved to the Shire from another part of Victoria in the five years prior to 2011. 210 residents (3.3%) moved to the Shire from another part of Australia in the five years to 2011.
The educational qualifications attained by Buloke residents are comparatively less than found in regional Victoria with only 1,703 residents (32.6%) holding postsecondary educational qualifications.
Compared to regional Victoria, in 2011 there was a smaller proportion of high-income households (those earning $1,500 per week or more) and a larger proportion of low-income households (those earning less than $600 per week) in Buloke. Overall, 221 Buloke households (8.3%) earned a high income, and 408 (15.4%) were low-income households, compared with 10.3% and 12.3% respectively for regional Victoria.
Our Local Economy
Workplaces in Buloke provide approximately 2,725 jobs.
Agriculture is the most substantial employment sector in the Shire, providing 818 jobs (30.0%). This is followed by 319 jobs (11.7%) in the health sector, 227 (8.3%) in the education sector, 214 (7.9%) in the retail trades sector and 155 (5.7%) in the public administration sector. A small number of people work in the manufacturing sector (130 or 4.8%) and the construction sector (149 or 5.5%).
Between 2006 and 2011 the proportion of persons working in the agriculture sector, retail, manufacturing and education sectors all fell. The number of persons who reported working in the agriculture sector fell by 15% (140 jobs over the five-year period). Jobs in the retail sector fell 15% with falls of 6% and 3% respectively in the manufacturing and education sectors. Increases were reported in the transport and technical sectors, but the numbers were small.
Volunteering is an important part of the Buloke economy and is an accepted indicator of community cohesiveness and wellbeing, and of how readily individuals are able to contribute to their community. Analysis of the voluntary work performed in Buloke in 2011 compared to regional Victoria shows that there was a higher proportion of persons participating in volunteer activities in Buloke than in the average of other rural municipalities.
Drivers of Change
Increased agricultural productivity
Increased agricultural productivity and the emergence of larger farms across the Shire have resulted in fewer farms and less demand for workers, leading to population loss. This process has been particularly pronounced in recent years and current trends suggest it will continue in the future.
Between 2001 and 2011, the number of farms in the Shire fell from over 710 to under 554.
Population decline
The general trend across dry land farming areas in Victoria is that towns between one and two thousand people are experiencing continuing population decline due to job losses in agriculture and other sectors where services have been withdrawn, such as banking, government administration and education. As commented earlier this is likely to continue into the future.
A changing climate
Water availability is a major driver of economic growth, environmental health and liveability in Buloke. Over the next 20 to 50 years climate change is predicted to result in higher average temperatures, lower average rainfall, greater intensity of rainfall, and potentially an increase in the frequency of droughts.
Global food demand
The expected increase in global food demand will provide opportunities for food producing regions that can successfully adapt to climate change and other factors affecting agriculture, such as energy costs, volatile international commodity markets, varying currency valuations and the impact of new markets in emerging regions for high quality products.
Liveability factors
Various factors influence people’s choices on where to live include availability of employment, choice and affordability of housing, education, health, cultural, family proximity and lifestyle features.
Employment is likely to continue to be the single largest factor impacting on choice to locate in Buloke.
Migration
Another population trend in rural Victoria has been the outward migration of young people to regional centres and metropolitan Melbourne for education and employment opportunities and the inward migration of people in the 50 to 64 age bracket.
In Buloke there has been a consistent net outward migration of young people to Melbourne or larger regional centres such as Bendigo, Ballarat and Mildura for education and employment over the past 30 years.
Accompanying this loss of younger residents, for the majority of the period since 1981 there has been a net inward migration of residents in the 50 to 64 age bracket. This inward migration has been for liveability and affordability reasons.
Both of these trends are expected to continue into the future.
Budget implications
As a result of the Shire’s demographic profile there are a number of budget implications in the short and long term:
· Population decline will result in the rate burden being borne by a smaller rate base. This has resulted in a requirement to review service levels and reduce the operating expenditure of the council. This will see an overall reduction in staff numbers in the 2014/15 and 2015/16 financial years.
· The Shire’s reliance on community volunteers has seen the budget retain funding levels to areas of the community which rely on volunteer services.
3.2 External influences
· Consumer Price Index (CPI) increases on goods and services of 2.7% through the year to December quarter 2013 (ABS release 22 January 2014 State-wide CPI is forecast to be 2.5% for the 2014/15 year (Victorian Budget Papers 2013/14).
· Australian Average Weekly Earnings (AWE) growth for Public Sector full-time adult ordinary time earnings in the 12 months to May 2013 was 4.5% (ABS release 15 August 2013). The wages price index in Victoria is projected to be 3.5% per annum in 2014/15 and the subsequent two years (Victorian Budget Papers 2013/14). Council must renegotiate a new Collective Agreement during the 2014/15 year. Completion of the substantial Flood Recovery works will see a significant reduction in external grant funds.
· The Abbott Government introduced the Clean Energy Legislation (Carbon Tax Repeal) Bill 2013 and related bills to the House of Representatives on the 13th of November 2013, with the intention to abolish the carbon price from 1 July 2014.
· The Fire Services Property Levy will continue to be collected by Council on behalf of the State Government with the introduction of the Fire Services Property Levy Act 2012.
3.3 Internal influences
As well as external influences, there are also a number of internal influences which are expected to have a significant impact on the preparation of the 2014/15 Budget. These matters have arisen from events occurring in the 2013/14 year resulting in variances between the forecast actual and budgeted results for that year and matters expected to arise in the 2014/15 year. These matters and their financial impact are set out below:
· The funding partnership from the Uniting Church for Youth services has ended. This will result in a rationalisation of our Youth, Economic Development and Community Services.
· A review of Waste Services has identified a significant shortfall in income from users of the service. The budget makes provision for full cost recovery for Council’s garbage charge.
3.4 Budget principles
In response to these influences, guidelines were prepared and distributed to all Council officers with budget responsibilities. The guidelines set out the key budget principles upon which the officers were to prepare their budgets. The principles included:
· Existing fees and charges to be increased in line with CPI or market levels.
· Grants to be based on confirmed funding levels.
· New revenue sources to be identified where possible.
· Salaries and wages to be increased in line with EBA arrangements.
· Real savings in operating expenditure to be implemented over the 2014/15 and 2015/16 financial year.
· Construction and material costs to increase in line with the Engineering Construction Index.
· Operating revenues and expenses arising from completed 2013/14 capital projects to be included.
3.5 Long term strategies
The budget includes consideration of a number of long term strategies and contextual information to assist Council to prepare the Budget in a proper financial management context. These include a Strategic Resource Plan for 2014/15 to 2017/18 (section 8.), Rating Information (section 9.) and Other Long Term Strategies (section 10.) including borrowings and service reviews.
Buloke Shire Council Special Meeting Wednesday, 25 June 2014
5.1.1 Adoption of Budget for Municipal Year Ending 30 June 2015
Attachment 1 Draft 2014-15 Budget for Adoption
4. Analysis of operating budget
This section analyses the operating budget including expected income and expenses of the Council for the 2014/15 year.
4.1 Budgeted income statement
|
|
Ref |
Forecast Actual 2013/14 $’000 |
Budget 2014/15 $’000 |
Variance
$’000 |
|
Total income |
4.2 |
57,178 |
25,319 |
(31,859) |
|
Total expenses |
4.3 |
(25,411) |
(24,370) |
1,041 |
|
Surplus (deficit) for the year |
|
31,767 |
949 |
(30,818) |
|
Grants – capital non-recurrent |
4.2.6 |
(40,350) |
(4,969) |
35,381 |
|
Contributions - non-monetary assets |
|
0 |
0 |
0 |
|
Capital contributions - other sources |
4.2.4 |
(519) |
(1,120) |
(601) |
|
Adjusted underlying surplus (deficit) |
4.1.1 |
(9,102) |
(5,140) |
3,962 |
4.1.1 Adjusted underlying deficit ($3.96 million decrease)
The adjusted underlying result is the net surplus or deficit for the year adjusted for non-recurrent capital grants, non-monetary asset contributions, and capital contributions from other sources. It is a measure of financial sustainability and Council’s ability to achieve its service delivery objectives as it is not impacted by capital income items which can often mask the operating result. The adjusted underlying result for the 2014/15 year is a deficit of $5.14 million which is an improvement of $3.96 million from the 2013/14 year. In calculating the adjusted underlying result, Council has excluded grants received for capital purposes which are non-recurrent and capital contributions from other sources.
4.2 Income
|
Income Types |
Ref |
Forecast Actual 2013/14 $’000 |
Budget 2014/15 $’000 |
Variance
$’000 |
|
Rates and charges |
4.2.1 |
10,446 |
11,453 |
1,007 |
|
Statutory fees and fines |
4.2.2 |
86 |
84 |
(2) |
|
User fees |
4.2.3 |
709 |
744 |
35 |
|
Contributions - cash |
4.2.4 |
589 |
132 |
(457) |
|
Grants - operating |
4.2.5 |
3,945 |
6,665 |
2,720 |
|
Grants – capital |
4.2.6 |
40,350 |
5,969 |
(34,381) |
|
Net gain on sale of assets |
4.2.7 |
14 |
10 |
(4) |
|
Other income |
4.2.8 |
1,039 |
262 |
(777) |
|
Total income |
|
57,178 |
25,319 |
(31,859) |
4.2.1 Rates and charges ($1.01 million increase)
It is proposed that general rate income be increased by 6.0% over 2013/14 to $9.514 million. Kerbside waste and recycling charges are proposed to increase to $1.28 million (49% increase) to reflect full cost recovery. Section 9. “Rating Information” includes a more detailed analysis of the rates and charges to be levied for 2014/15. Information on rates and charges specifically required by the Regulations is included in Appendix B.
4.2.2 Statutory fees and fines ($0.02 million decrease)
Statutory fees relate mainly to fees and fines levied in accordance with legislation and include animal registrations. These form a minor part of council income stream.
A detailed listing of statutory fees is included in Appendix D.
4.2.3 User fees ($0.03 million increase)
User charges relate mainly to the recovery of service delivery costs through the charging of fees to users of Council’s services. These include, use community facilities and the provision of human services such as family day care and home help services. In setting the budget, the key principle for determining the level of user charges has been to ensure that increases do not exceed CPI increases or market levels.
A detailed listing of fees and charges is included in Appendix D.
4.2.4 Contributions - cash ($0.46 million decrease)
Contributions relate to monies paid by developers in accordance with planning permits issued for property development and by community groups for contributions to capital projects.
Contributions are projected to decrease by $0.46 million compared to 2013/14 due mainly to the completion of a number of community projects within the municipality during the 2013/14 year.
4.2.5 Grants - operating ($2.72 million increase)
Operating
grants include all monies received from State and Federal sources for the
purposes of funding the delivery of Council’s services to ratepayers. Overall,
the level of operating grants has increased by $2.72 million compared to 2013/14. The
increase in Victoria Grants Commission (VGC) funding, is related to the
adjusted timing of which we have been advised with regard to receiving the
funding.
A list of operating grants by type and source, classified into recurrent and non-recurrent, is included below.
|
Operating Grant Funding Types and Source |
Forecast Actual 2013/14 $’000 |
Budget 2014/15 $’000 |
Variance
$’000 |
|
Recurrent - Commonwealth Government |
|
|
|
|
Victorian Grants Commission |
2,679 |
5,469 |
2,790 |
|
Family day care |
|
|
|
|
General home care |
561 |
563 |
2 |
|
Other (*specify each type) |
|
|
|
|
Recurrent - State Government |
|
|
|
|
Primary care partnerships |
|
|
|
|
Aged care |
164 |
162 |
(2) |
|
School crossing supervisors |
12 |
12 |
0 |
|
Libraries |
99 |
98 |
(1) |
|
Maternal and child health |
135 |
130 |
(5) |
|
Recreation |
55 |
55 |
0 |
|
Community safety |
24 |
24 |
0 |
|
Other (*specify each type) |
67 |
102 |
35 |
|
Total recurrent grants |
3,796 |
6,615 |
2,819 |
|
|
|
|
|
|
Non-recurrent - Commonwealth Government |
|
|
|
|
Drainage maintenance |
|
- |
|
|
Environmental planning |
80 |
50 |
(30) |
|
Non-recurrent - State Government |
|
|
|
|
Community health |
69 |
0 |
(69) |
|
Family and children |
- |
|
|
|
Total non-recurrent grants |
149 |
50 |
(99) |
4.2.6 Grants - capital ($34.38 million decrease)
Capital grants include all
monies received from State, Federal and community sources for the purposes of
funding the capital works program. Overall the level of capital grants has
decreases by $35.39 million compared to 2013/14
due to the completion of flood works in
the previous year. Section 6. “Analysis of Capital Budget” includes a more
detailed analysis of the grants and contributions expected to be received
during the 2014/15 year.
A list of capital grants by type and source, classified into recurrent and
non-recurrent, is included below. Some of these grants are subject to funding
announcements.
|
Capital Grant Funding Types and Source |
Forecast Actual 2013/14 $’000 |
Budget 2014/15 $’000 |
Variance
$’000 |
|
Recurrent - Commonwealth Government |
|
|
|
|
Roads to recovery |
|
1,000 |
1,000 |
|
Recurrent - State Government |
- |
- |
- |
|
Country Roads and bridges |
1,000 |
1,000 |
0 |
|
Total recurrent grants |
1,000 |
2,000 |
1,000 |
|
Non-recurrent - Commonwealth Government |
|
|
|
|
Flood Grants |
37,900 |
700 |
(37,200) |
|
Buildings |
50 |
0 |
(50) |
|
Community Infrastructure |
539 |
581 |
42 |
|
Drainage |
|
1,558 |
1,558 |
|
Footpaths |
|
|
|
|
Non-recurrent - State Government |
|
|
|
|
Buildings |
861 |
1,130 |
259 |
|
Total non-recurrent grants |
39,350 |
3,969 |
(35,381) |
4.2.7 Net gain on sale of assets minor decrease)
Proceeds from the sale of Council assets are forecast to be $10,000 for 2014/15 which relates to the sale of minor plant.
4.2.8 Other income ($0.88 million decrease)
Other income relates to a range of items such as private works, cost recoups and other miscellaneous income items. It also includes interest revenue on investments and rate arrears.
Other income is forecast to decrease by $0.88 million compared to 2013/14. This is mainly due to the work that was carried out by council works crews on the Flood Contract which will not be available in 2013/14.
4.3 Expenses
|
Expense Types |
Ref |
Forecast Actual 2013/14 $’000 |
Budget 2014/15 $’000 |
Variance
$’000 |
|
Employee costs |
4.3.1 |
10,107 |
10,135 |
28 |
|
Materials and services |
4.3.2 |
6,583 |
5,785 |
(798) |
|
Bad and doubtful debts |
4.3.3 |
13 |
11 |
(2) |
|
Depreciation and amortisation |
4.3.4 |
7,707 |
7,334 |
(373) |
|
Finance costs |
4.3.5 |
127 |
376 |
249 |
|
Other expenses |
4.3.6 |
874 |
729 |
(145) |
|
Total expenses |
|
25,411 |
24,370 |
(1,041) |
Source: Appendix A
4.3.1 Employee costs ($.03 million increase)
Employee costs include all labour related expenditure such as wages and salaries and on-costs such as allowances, leave entitlements, employer superannuation, rostered days off, etc.
Employee costs are forecast to increase by $28,000 compared to 2013/14. Staff numbers are projected to decrease by 5 EFT from the 2013/14 budget with salary increases as per the Enterprise Agreement.
A summary of human resources expenditure categorised according to the organisational structure of Council is included below:
|
|
|
Comprises |
|
|
Department |
Budget 2014/15 $’000 |
Permanent Full time $’000 |
Permanent Part Time $’000 |
|
Asset & Infrastructure |
1,236 |
1,116 |
120 |
|
Community Services |
1,414 |
494 |
920 |
|
Corporate Services |
1,044 |
817 |
227 |
|
Finance & Governance |
2,032 |
1,881 |
151 |
|
Works & Construction |
3,881 |
3,558 |
323 |
|
Total permanent staff expenditure |
9,607 |
7,866 |
1,741 |
|
Casuals and other expenditure |
528 |
|
|
|
Total operating expenditure |
10,135 |
|
|
|
Capital expenditure |
235 |
|
|
|
Total expenditure |
10,370 |
|
|
A summary of the number of full time equivalent (FTE) Council staff in relation to the above expenditure is included below:
|
|
|
Comprises |
|
|
Department |
Budget FTE
|
Permanent Full time |
Permanent Part Time
|
|
Asset & Infrastructure |
15.5 |
14 |
1.5 |
|
Community Services |
19.2 |
6 |
13.2 |
|
Corporate Services |
12.4 |
10 |
2.4 |
|
Finance & Governance |
21.4 |
20 |
1.4 |
|
Works & Construction |
54.4 |
51 |
3.4 |
|
Total permanent operating staff |
126 |
104 |
22 |
|
Casuals and other |
7.6 |
|
|
|
Total Capital works staff |
3 |
3 |
|
|
Total staff |
133.6 |
|
|
4.3.2 Materials and services ($0.79 million decrease)
Materials and services include the purchases of consumables, payments to contractors for the provision of services and utility costs. Materials and services are forecast to decrease by $0.79 million compared to 2013/14.
The reductions are in a range of areas including consultant fees ($200,000), road material ($100,000) and fuel ($60,000) as well as other areas such as labour hire, IT maintenance and contract.
4.3.3 Bad and doubtful debts (minor decrease)
Bad and doubtful debts is projected to remain at similar level to the previous year with only a $2,000 decrease.
4.3.4 Depreciation and amortisation ($0.37 million decrease)
Depreciation is an accounting measure which attempts to allocate the value of an asset over its useful life for Council’s property, plant and equipment including infrastructure assets such as roads and drains. There will be an increase in depreciation of $161,000 due to the completion of the 2014/15 capital works program and the full year effect of depreciation on the 2013/14 capital works program. This increase will be more than offset by a decrease of $531,000 in the depreciation on roads due to the adoption by council of the road management plan. Refer to section 6. ‘Analysis of Capital Budget’ for a more detailed analysis of Council’s capital works program for the 2014/15 year.
4.3.5 Finance costs ($0.25 million increase)
Borrowing costs relate to interest charged by financial institutions on funds borrowed. The increase in finance costs relate to the $7.0 million loan provided for in the budget. The taking of a loan will allow council to manage its cash position and negate the need to run a significant overdraft position. This will see an overall savings in finance costs, had council relied on overdraft facilities to fund operating activities and capital works expenditures.
4.3.6 Other expenses ($0.15 million decrease)
Other expenses relate to a range of unclassified items.
Buloke Shire Council Special Meeting Wednesday, 25 June 2014
5.1.1 Adoption of Budget for Municipal Year Ending 30 June 2015
Attachment 1 Draft 2014-15 Budget for Adoption
5. Analysis of budgeted cash position
This section analyses the expected cash flows from the operating, investing and financing activities of Council for the 2014/15 year. Budgeting cash flows for Council is a key factor in setting the level of rates and providing a guide to the level of capital expenditure that can be sustained with or without using existing cash reserves.
The analysis is based on three main categories of cash flows:
· Operating activities - Refers to the cash generated or used in the normal service delivery functions of Council. Cash remaining after paying for the provision of services to the community may be available for investment in capital works, or repayment of debt
· Investing activities - Refers to cash generated or used in the enhancement or creation of infrastructure and other assets. These activities also include the acquisition and sale of other assets such as vehicles, property and equipment
· Financing activities - Refers to cash generated or used in the financing of Council functions and include borrowings from financial institutions and advancing of repayable loans to other organisations. These activities also include repayment of the principal component of loan repayments for the year.
5.1 Budgeted cash flow statement
|
|
Ref
|
Forecast Actual 2013/14 $’000 |
Budget 2014/15 $’000 |
Variance
$’000 |
|
Cash flows from operating activities |
5.1.1 |
|
|
|
|
Receipts |
|
|
|
|
|
Rates and charges |
|
10,400 |
11,440 |
1,040 |
|
User fees and fines |
|
814 |
827 |
13 |
|
Grants - operating |
|
3,944 |
6,665 |
2,721 |
|
Grants - capital |
|
40,350 |
5,969 |
(34,381) |
|
Interest |
|
70 |
50 |
(20) |
|
Other receipts |
|
927 |
471 |
(456) |
|
|
|
56,505 |
25,422 |
(31,083) |
|
Payments |
|
|
|
|
|
Employee costs |
|
(10,418) |
(10,134) |
284 |
|
Other payments |
|
(7,500) |
(6,514) |
986 |
|
|
|
(17,918) |
(16,648) |
1,270 |
|
Net cash provided by operating activities |
38,587 |
8,774 |
(29,813) |
|
|
|
|
|
|
|
|
Cash flows from investing activities |
5.1.2 |
|
|
|
|
Proceeds from sales of property, infrastructure, plant and equipment |
|
24 |
10 |
(14) |
|
Repayment of loans and advances |
|
(1,582) |
0 |
1,582 |
|
Deposits |
|
0 |
0 |
0 |
|
Payments for property, infrastructure, plant and equipment |
|
(44,146) |
(10,465) |
33,681 |
|
Net cash used in investing activities |
(45,704) |
(10,455) |
35,249 |
|
|
|
|
|
|
|
|
Cash flows from financing activities |
5.1.3 |
|
|
|
|
Finance costs |
|
(130) |
(376) |
(246) |
|
Proceeds from borrowings |
|
1,550 |
7,000 |
5,450 |
|
Repayment of borrowings |
|
(565) |
(782) |
(217) |
|
Net cash used in financing activities |
855 |
5,842 |
4,987 |
|
|
Net (decrease)/increase in cash and cash equivalents |
(6,262) |
4,161 |
10,423 |
|
|
Cash and cash equivalents at the beginning of the period |
2,116 |
(4,146) |
(6,262) |
|
|
Cash and cash equivalents at end of the year |
5.1.4 |
(4,146) |
15 |
4,161 |
Source: Appendix A
5.1.1 Operating activities ($29.81 million decrease)
The significant decrease in cash inflows from operating activities is due to the reduction in capital grants to fund the flood reconstruction works. Excluding the capital contribution for flood works there is an increase in receipts reflecting the 6% rise in rates and the increase in the kerbside waste and recycling charge ($0.43 million). In addition to this there is an increase in grants of $2.72 million which is due to the timing of when we will receive grants commission funding.
The net cash flows from operating activities does not equal the surplus (deficit) for the year as the expected revenues and expenses of the Council include non-cash items which have been excluded from the Cash Flow Statement. The budgeted operating result is reconciled to budgeted cash flows available from operating activities as set out in the following table.
|
|
|
Forecast Actual 2013/14 $’000 |
Budget 2014/15 $’000 |
Variance
$’000 |
|
|
Surplus (deficit) for the year |
|
21,665 |
949 |
(20,716) |
|
|
Revaluation |
|
10,102 |
0 |
(10,102) |
|
|
Depreciation |
|
7,707 |
7,334 |
(373) |
|
|
Loss (gain) on sale of assets |
|
(14) |
(10) |
4 |
|
|
Net movement in current assets and liabilities |
|
(873) |
501 |
1,374 |
|
|
Cash flows available from operating activities |
38,587 |
8,774 |
(29,813) |
||
5.1.2 Investing activities ($35.25 million decrease)
The large decrease in payments for investing activities represents large capital works expenditure disclosed related to the flood recovery works. It is planned to implement a review and sale of council property. Proceeds from sale of assets of this nature are not forecast in the 2014/15 Budget due to expected settlement of land sales not being received until the 2015/16 year.
5.1.3 Financing activities ($4.99 million increase)
The increase reflects the $7.0 million loan borrowings for the 2014/15 year. Adjustments have been made to repay the current loans of council (0.78 million) and a subsequent increase in finance costs to repay the interest on the new loan amount.
5.1.4 Cash and cash equivalents at end of the year ($4.16 million increase)
Overall, total cash and investments is forecast to increase by $4.16 million as at 30 June 2015, reflecting Council’s strategy of using borrowings in the medium term to finance operating activities. This is consistent with Council’s Strategic Resource Plan (see Section 8), which forecasts a significant reduction in the capital works program from 2014/15 onwards to balance future cash budgets.
5.2 Restricted and unrestricted cash and investments
Cash and cash equivalents held by Council are restricted in part, and not fully available for Council’s operations. The budgeted cash flow statement above indicates that Council is estimating at 30 June 2015 it will have cash and investments of $0.015 million, which has been partly restricted as shown in the following table.
|
|
|
Forecast |
|
|
|
|
|
Actual |
Budget |
Variance |
|
|
Ref |
2014 |
2015 |
|
|
|
|
$’000 |
$’000 |
$’000 |
|
Total cash and investments |
|
(4,146) |
15 |
4,161 |
|
Restricted cash and investments |
|
|
|
|
|
- Statutory reserves |
5.2.1 |
0 |
0 |
0 |
|
- Cash held to fund carry forward capital works |
5.2.2 |
3,633 |
0 |
3,633 |
|
- Trust funds and deposits |
|
116 |
116 |
0 |
|
Unrestricted cash and investments |
5.2.3 |
(7,895) |
(101) |
7,794 |
|
- Discretionary reserves |
5.2.4 |
0 |
0 |
0 |
|
Unrestricted cash adjusted for discretionary reserves |
5.2.5 |
(7,895) |
(101) |
7,794 |
5.2.1 Statutory reserves
These funds must be applied for specified statutory purposes in accordance with various legislative requirements. Council do not have any Statutory Reserves.
5.2.2 Cash held to fund carry forward capital works
There is no amount shown as cash held to fund carry forward works at 30 June 2015, as it is expected that the capital works budget in the 2014/15 financial year will be fully completed. An amount of $3.6 million is forecast to be held at 30 June 2014 to fund capital and flood reconstruction works completed but not paid in the 2013/14 financial year. Section 6.2 contains further details on capital works funding.
5.2.3 Unrestricted cash and investments ($NIL)
The amount shown is in accordance with the definition of unrestricted cash included in the Regulations. These funds are free of statutory reserve funds and cash to be used to fund capital works expenditure from the previous financial year. This has to be a positive number for the cash to be unrestricted.
5.2.4 Discretionary reserves ($NIL)
These funds are shown as discretionary reserves as, although not restricted by a statutory purpose, Council has made decisions regarding the future use of these funds and unless there is a Council resolution these funds should be used for those earmarked purposes. The decisions about future use of these funds has been reflected in Council’s Strategic Resource Plan and any changes in future use of the funds will be made in the context of the future funding requirements set out in the plan.
5.2.5 Unrestricted cash adjusted for discretionary reserves ($NIL)
These funds are free of all specific Council commitments and represent funds available to meet daily cash flow requirements, unexpected short term needs and any budget commitments which will be expended in the following year such as grants and contributions. The SRP identifies improvements in the unrestricted cash in forward years. This has to be a positive number for the cash to be unrestricted.
Buloke Shire Council Special Meeting Wednesday, 25 June 2014
5.1.1 Adoption of Budget for Municipal Year Ending 30 June 2015
Attachment 1 Draft 2014-15 Budget for Adoption
6. Analysis of capital budget
This section analyses the planned capital works expenditure budget for the 2014/15 year and the sources of funding for the capital budget.
6.1 Capital works expenditure
|
|
Ref |
Forecast |
Budget |
Variance |
||
|
|
Actual |
2014/15 |
|
|||
|
Capital Works Areas |
2013/14 |
$’000 |
$’000 |
|||
|
|
$’000 |
|
|
|||
|
Works carried forward |
6.1.1 |
|
||||
|
Property |
|
|||||
|
Buildings |
1,806 |
1,806 |
||||
|
Total property |
0 |
1,806 |
1,806 |
|||
|
Plant and equipment |
|
|
||||
|
Plant, machinery and equipment |
|
|||||
|
Computers and telecommunications |
|
|
||||
|
Total plant and equipment |
0 |
0 |
0 |
|||
|
Infrastructure |
|
|
||||
|
Rec, leisure and community facilities |
78 |
78 |
||||
|
Total infrastructure |
0 |
78 |
78 |
|||
|
Total works carried forward |
0 |
1, 884 |
1,884 |
|||
|
|
|
|||||
|
New works |
|
|||||
|
Property |
6.1.2 |
|
|
|||
|
Buildings |
2,392 |
819 |
(1,573) |
|||
|
Building improvements |
|
|
|
|||
|
Total property |
2,392 |
819 |
(1,573) |
|||
|
Plant and equipment |
6.1.3 |
|
|
|||
|
Plant, machinery and equipment |
595 |
760 |
165 |
|||
|
Fixtures, fittings and furniture |
||||||
|
Computers and telecommunications |
343 |
150 |
-193 |
|||
|
Library books |
|
|
|
|||
|
Total plant and equipment |
938 |
910 |
(28) |
|||
|
Infrastructure |
6.1.4 |
|
|
|||
|
Roads |
42,904 |
1,494 |
(41,410) |
|||
|
Bridges |
400 |
400 |
0 |
|||
|
Footpaths and cycleways |
3 |
94 |
91 |
|||
|
Drainage |
150 |
1,760 |
1,610 |
|||
|
Waste management |
5 |
|
(5) |
|||
|
Parks, open space and streetscapes |
|
|
||||
|
Aerodromes |
10 |
10 |
||||
|
Other infrastructure |
79 |
36 |
(43) |
|||
|
Kerb and Channel |
11 |
87 |
76 |
|||
|
Landfill |
44 |
190 |
146 |
|||
|
Saleyards |
|
99 |
99 |
|||
|
Total infrastructure |
43,596 |
4,170 |
(39,426) |
|||
|
Total new works |
46,926 |
5,899 |
(41,027) |
|||
|
|
|
|||||
|
Total capital works expenditure |
46,926 |
7,783 |
(39,143) |
|||
|
|
|
|
|
|
||
|
|
Actual |
2014/15 |
|
|||
|
Capital Works Areas |
2013/14 |
$’000 |
$’000 |
|||
|
|
$’000 |
|
|
|||
|
Represented by: |
|
|
||||
|
Asset renewal expenditure |
6.1.5 |
45,527 |
4,085 |
(41,442) |
|
|
|
New asset expenditure |
6.1.5 |
1,131 |
2,042 |
911 |
|
|
|
Asset upgrade expenditure |
6.1.5 |
268 |
1,656 |
1,388 |
|
|
|
Asset expansion expenditure |
6.1.5 |
|
|
|
|
|
|
Total capital works expenditure |
|
46,926 |
7,783 |
(39,143) |
|
|
Source: Appendix A. A more detailed listing of the capital works program is included in Appendix C.
6.1.1 Carried forward works ($1.884 million)
At the end of each financial year there are projects which are either incomplete or not commenced due to factors including planning issues, weather delays and extended consultation. For the 2013/14 year it is forecast that $1.88 million of capital works will be incomplete and be carried forward into the 2014/15 year. These works are for 5 projects the Donald Family Services Centre, Birchip Bowling Green Redevelopment, Charlton 2020 Design Services, Charlton Skate Park and Wycheproof Centenary Park Shade Structure.
6.1.2 Property ($0.82 million)
The property class comprises buildings and building improvements including community facilities, municipal offices, sports facilities, swimming pools and pavilions.
For the 2014/15 year, $0.82 million will be expended on building and building improvement projects. These works include a program of upgrades to kitchens, heating and cooling in Council’s Community Halls.
6.1.3 Plant and equipment ($0.91 million)
Plant and equipment includes plant, machinery and equipment, computers and telecommunications, and library books.
For the 2014/15 year, $0.91 million will be expended on plant, equipment and other projects. This includes the replacement of 3 of Council’s grader fleet with a new grader.
6.1.4 Infrastructure ($4.17 million)
Infrastructure includes roads, bridges, footpaths, drainage, recreation, parks, open space and streetscapes, landfills, aerodromes, saleyards and other structures.
For the 2014/15 year, $1.56 million will be expended on road projects. These projects are fully funded from the Roads to Recovery program and the Country Roads and Bridges Program.
$1.68 million will be expended on drainage projects with funding for a detailed Levee design for Charlton, the St Arnaud Road floodway and the stage 1 levee bank development at Donald.
6.1.5 Asset renewal ($4.08 million), new assets ($2.04 million) and upgrade ($1.65 million)
A distinction is made between expenditure on new assets, asset renewal and upgrade. Expenditure on asset renewal is expenditure on an existing asset, or on replacing an existing asset that returns the service of the asset to its original capability. Expenditure on new assets does not have any element of expansion or upgrade of existing assets but will result in an additional burden for future operation, maintenance and capital renewal.
The major projects included in the above categories, which constitute expenditure on new assets, are for the flood development works, which will develop new infrastructure for flood protection.
6.2 Funding sources
|
Sources of Funding |
Ref
|
Forecast Actual 2013/14 $’000 |
Budget 2014/15 $’000 |
Variance
$’000 |
|
Works carried forward |
|
|
|
|
|
Current year funding |
|
|
|
|
|
Grants |
|
5,348 |
1,696 |
(3,652) |
|
Council cash |
|
|
|
|
|
- operations |
|
|
188 |
188 |
|
Total works carried forward |
6.2.1 |
5,348 |
1,884 |
(3,464) |
|
|
|
|
|
|
|
New works |
|
|
|
|
|
Current year funding |
|
|
|
|
|
Grants |
6.2.2 |
1,582 |
4,419 |
2,837 |
|
-Flood Grants |
|
37,900 |
|
(37,900) |
|
Contributions |
|
590 |
22 |
(568) |
|
Borrowings |
|
|
|
|
|
Council cash |
|
|
|
|
|
- operations |
6.2.3 |
1,506 |
1,458 |
(448) |
|
- reserve cash |
|
|
|
|
|
Total new works |
|
41,578 |
5,899 |
(35,679) |
|
Total funding sources |
|
46,926 |
7,783 |
(39,143) |
Source: Appendix A
6.2.1 Carried forward works ($1.884 million)
At the end of each financial year there are projects which are either incomplete or not commenced due to factors including planning issues, weather delays and extended consultation. For the 2013/14 year it is forecast that $1.884 million of capital works will be incomplete and be carried forward into the 2014/15 year . The Donald Family services centre is the major project, which was funded from grants.
6.2.2 Grants ($4.419 million)
Capital grants include all monies received from State and Federal sources for the purposes of funding the capital works program. Significant grants and contributions are budgeted to be received from Roads to Recovery and Country Roads and Bridges program ($2.0 million). The budget also provides for funding from the Local Infrastructure program and funding for flood related works ($1.675 mill). All flood related capital works will be completed in the 2013/14 year.
6.2.3 Council cash - operations ($1.458million)
Council will need to use cash from its operating activities, as a funding source for the capital works program. It is forecast that $1.46 million will be generated from operations to fund the 2014/15 new capital works program.
Buloke Shire Council Special Meeting Wednesday, 25 June 2014
5.1.1 Adoption of Budget for Municipal Year Ending 30 June 2015
Attachment 1 Draft 2014-15 Budget for Adoption
7. Analysis of budgeted financial position
This
section analyses the movements in assets, liabilities and equity between 2013/14 and
2014/15.
It also considers a number of key performance indicators.
7.1 Budgeted balance sheet
|
|
Ref
|
Forecast Actual 2014 $’000 |
Budget 2015 $’000 |
Variance
$’000 |
|
Current assets |
7.1.1 |
|
|
|
|
Cash and cash equivalents |
|
(4,146) |
15 |
4,161 |
|
Trade and other receivables |
|
1,210 |
1,223 |
13 |
|
Financial assets |
|
0 |
0 |
0 |
|
Other assets |
|
151 |
151 |
0 |
|
Total current assets |
|
(2,785) |
1,389 |
4,174 |
|
|
|
|
|
|
|
Non-current assets |
7.1.1 |
|
|
|
|
Property, infrastructure, plant and equipment |
|
186 |
186 |
0 |
|
Investments in regional library corporation |
|
180,772 |
181,335 |
563 |
|
Total non-current assets |
|
180,958 |
181,521 |
563 |
|
Total assets |
|
178,173 |
182,910 |
4,737 |
|
|
|
|
|
|
|
Current liabilities |
7.1.2 |
|
|
|
|
Trade and other payables |
|
4,765 |
2,335 |
2,430 |
|
Interest-bearing loans and borrowings |
|
985 |
203 |
782 |
|
Provisions |
|
2,194 |
2,194 |
0 |
|
Total current liabilities |
|
7,944 |
4,732 |
3,212 |
|
|
|
|
|
|
|
Non-current liabilities |
7.1.2 |
|
|
|
|
Interest-bearing loans and borrowings |
|
0 |
7,000 |
(7,000) |
|
Provisions |
|
1,535 |
1,535 |
0 |
|
Total non-current liabilities |
|
1,535 |
8,535 |
(7,000) |
|
Total liabilities |
|
9,479 |
13,267 |
(3,788) |
|
Net assets |
|
168,694 |
169,643 |
949 |
|
|
|
|
|
|
|
Equity |
7.1.4 |
|
|
|
|
Accumulated surplus |
|
82,647 |
83,596 |
949 |
|
Asset revaluation reserve |
|
86,047 |
86,047 |
0 |
|
Total equity |
|
168,694 |
169,643 |
949 |
Source: Appendix A
7.1.1 Current Assets ($4.17 million increase) and Non-Current Assets ($0.56 million increase)
Cash and cash equivalents include cash and investments such as cash held in the bank and in petty cash. These balances are projected to increase by $4.2 million during the year mainly due to the injection of loan funds into the cash balance.
Trade and other receivables are monies owed to Council by ratepayers, sundry debtors and others. Short term debtors are not expected to change significantly in the budget.
Other assets includes items such as prepayments for expenses that Council has paid in advance of service delivery, inventories or stocks held for sale or consumption in Council’s services and other revenues due to be received in the next 12 months. Accrued income is not expected to change during the 2014/15 year.
Property, infrastructure, plant and equipment is the largest component of Council’s worth and represents the value of all the land, buildings, roads, vehicles, equipment, etc which has been built up by Council over many years. The increase in this balance is attributable to the proposed capital expenditure being greater than depreciation in this year.
7.1.2 Current Liabilities ($3.12 million decrease) and Non-Current Liabilities ($7.0 million increase)
Trade and other payables are those to whom Council owes money as at 30 June. These liabilities are budgeted to reduce in the 2014/15 year. It is budgeted that works on the flood reconstruction works will be completed by 30 June 2014; however Council will not have made the final payment to the contractor by that date. This payment of $2.8 million will be paid in the 2014/15 year therefore reducing Council’s liabilities.
Provisions include accrued long service leave, annual leave and rostered days off owing to employees. These employee entitlements are not expected to change over the 2014/15 year.
Interest-bearing loans and borrowings are borrowings of Council. Council is budgeting to borrow $7.0 million over the year.
7.1.3 Working Capital ($3.75 million increase)
Working capital is the excess of current assets above current liabilities. This calculation recognises that although Council has current assets, some of those assets are already committed to the future settlement of liabilities in the following 12 months, and are therefore not available for discretionary spending.
|
|
Forecast Actual 2014 $’000 |
Budget 2015 $’000 |
Variance
$’000 |
|
Current assets |
(2,785) |
1,389 |
(4,174) |
|
Current liabilities |
7,944 |
4,732 |
3,212 |
|
Working capital |
(10,729) |
(3,343) |
(7,386) |
|
Restricted cash and investment current assets |
|
|
|
|
- Statutory reserves |
0 |
0 |
0 |
|
- Cash held to fund carry forward capital works |
3,633 |
0 |
3,633 |
|
- Trust funds and deposits |
0 |
0 |
0 |
|
Unrestricted working capital |
(7,096) |
(3,343) |
(3,753) |
7.1.4 Equity ($0.95 million increase)
Total equity always equals net assets and is made up of the following components:
· Asset revaluation reserve which represents the difference between the previously recorded value of assets and their current valuations
· Other reserves that are funds that Council wishes to separately identify as being set aside to meet a specific purpose in the future and to which there is no existing liability. These amounts are transferred from the Accumulated Surplus of the Council to be separately disclosed
· Accumulated surplus which is the value of all net assets less Reserves that have accumulated over time. The increase in accumulated surplus of $0.95 million results directly from the surplus for the year.
8. Strategic resource plan and financial performance indicators
This section includes an extract of the adopted Strategic Resource Plan (SRP) to provide information on the long term financial projections of the Council.
8.1 Plan development
The Act requires a forward financial plan to be prepared covering both financial and non-financial resources, and including key financial indicators for at least the next four financial years to support the Council Plan.
Council has prepared a Financial Plan for the period 2014/15 to 2017/18 as part of its ongoing financial planning to assist in adopting a budget within a longer term framework.
The key objective, which underlines the development of the Plan, is financial sustainability in the medium term, while still achieving Council’s strategic objectives as specified in the Council Plan.
The financial plan for 2014 – 2018 is based on the following key strategies aimed at ensuring the long-term viability and amenity of the Shire:
· To increase revenue from rates and charges over the period of the Plan by a minimum of 6.0% per annum.
· To increase revenue from fees, fines and charges of 2.5% p.a. in 2014/15 and continuing at this level the remainder of the Plan or in line with cost increases or market levels as appropriate.
· To continue to receive untied Financial Assistance Grants from the Commonwealth at levels as determined by the Commonwealth Government.
· To reduce staff costs, with a particular focus on achieving these reductions in the first 2 years of the Plan.
· To contain increases in underlying staff costs over the life of the Plan.
· To base forward capital works funding projections only on known funding sources.
· In preparing the Plan, Council has also been mindful of the need to comply with the following Principles of Sound Financial Management as contained in the Act:
o Prudently manage financial risks relating to debt, assets and liabilities
o Provide reasonable stability in the level of rate burden
o Consider the financial effects of Council decisions on future generations
o Provide full, accurate and timely disclosure of financial information.
The Plan will be updated on a continuous basis as circumstances and opportunities change, new funding programs announced and the success of current and future grant applications are confirmed. Reference to the Plan will be made in Monthly Financial Management Reports to Council.
8.2 Financial resources
The following table summarises the key financial results for the next four years as set out in the SRP for years 2014/15 to 2017/18. Appendix A includes a more detailed analysis of the financial resources to be used over the four year period.
|
|
Forecast |
Budget |
Strategic Resource Plan |
Trend |
||
|
Indicator |
2013/14 |
2014/15 |
2015/16 |
2016/17 |
2017/18 |
+/o/- |
|
|
$’000 |
$’000 |
$’000 |
$’000 |
$’000 |
|
|
Surplus/(deficit) for the year |
21,665 |
949 |
1,956 |
2,290 |
2,818 |
+ |
|
Adjusted underlying result |
(9,102) |
(5,140) |
(2,186) |
(1,852) |
(1,324) |
+ |
|
Cash and investments balance |
(4,146) |
15 |
2,278 |
5,845 |
9,996 |
+ |
|
Cash flow from operations |
38,587 |
8,774 |
8,780 |
9,879 |
10,463 |
+ |
|
Capital works expenditure |
46,926 |
7,783 |
6,000 |
6,000 |
6,000 |
o |
Key to Forecast Trend:
+ Forecasts improvement in Council's financial performance/financial position indicator
o Forecasts that Council's financial performance/financial position indicator will be steady
- Forecasts deterioration in Council's financial performance/financial position indicator
The following graph shows the general financial indicators over the four year period.
The key outcomes of the SRP are as follows:
· Financial sustainability (section 5) – Councils cash position will improve over the life of the plan, which indicates a balanced budget on a cash basis in each year
· Rating levels (section 9) –Rate increases are forecast over the four years at an average of 6.0%, as well as full cost recovery for kerbside garbage and recycling charges.
· Borrowing strategy (section 10) – Borrowings are forecast to increase to $7.0 million in 2014/15 with an interest only period of five years.
· Service Reviews (section 10) - Reviews of services will result in budget savings of $1.28 million in 2014/15 and $3.35 million in subsequent years.
8.3 Financial performance indicators
The following table highlights Council’s current and projected performance across a range of key financial performance indicators. These indicators provide a useful analysis of Council’s financial position and performance and should be used in the context of the organisation’s objectives.
|
Indicator |
Measure |
Notes |
Forecast Actual |
Budget |
Strategic Resource Plan Projections |
Trend |
||
|
2013/14 |
2014/15 |
2015/16 |
2016/17 |
2017/18 |
+/o/- |
|||
|
Operating position |
|
|
|
|
|
|
|
|
|
Adjusted underlying result |
Adjusted underlying surplus (deficit) / Adjusted underlying revenue |
1 |
-55.8% |
-26.7% |
-11.0% |
-9.0% |
-6.2% |
+ |
|
Liquidity |
|
|
|
|
|
|
|
|
|
Working Capital |
Current assets / current liabilities |
2 |
-35.1% |
29.3% |
98.9% |
199.1% |
311.8% |
+ |
|
Unrestricted cash |
Unrestricted cash / current liabilities |
|
-68.8% |
-23.9% |
58.8% |
157.7% |
269.5% |
+ |
|
Obligations |
|
|
|
|
|
|
|
|
|
Loans and borrowings |
Interest bearing loans and borrowings / rate revenue |
3 |
9.4% |
62.9% |
57.8% |
54.7% |
51.8% |
- |
|
Loans and borrowings |
Interest and principal repayments on interest bearing loans and borrowings / rate revenue |
|
6.6% |
10.1% |
4.5% |
2.6% |
2.5% |
+ |
|
Indebtedness |
Non-current liabilities / own source revenue |
|
13.6% |
69.3% |
65.7% |
62.3% |
59.1% |
- |
|
Asset renewal |
Asset renewal expenses / depreciation |
4 |
600.8% |
52.4% |
81.8% |
81.8% |
81.9% |
o |
|
Stability |
|
|
|
|
|
|
|
|
|
Rates concentration |
Rate revenue / adjusted underlying revenue |
5 |
64.1% |
59.6% |
60.9% |
62.1% |
62.8% |
o |
|
Rates effort |
Rate revenue / CIV of rateable properties in the municipality |
|
0.9% |
0.9% |
1.0% |
1.0% |
1.1% |
o |
|
Efficiency |
|
|
|
|
|
|
|
|
|
Expenditure level |
Total expenditure / no. of property assessments |
|
$4,100 |
$3,920 |
$3,530 |
$3,570 |
$3,620 |
+ |
|
Revenue level |
Residential rate revenue / No. of residential property assessments |
|
$733 |
$765 |
$801 |
$841 |
$888 |
- |
|
Workforce turnover |
No. of permanent staff resignations & terminations / average no. of permanent staff for the financial year |
|
15% |
18% |
15% |
10% |
10% |
|
Key to Forecast Trend:
+ Forecasts improvement in Council's financial performance/financial position indicator
o Forecasts that Council's financial performance/financial position indicator will be steady
- Forecasts deterioration in Council's financial performance/financial position indicator
Notes to indicators
1 Adjusted underlying result – An indicator of the sustainable operating result required to enable Council to continue to provide core services and meet its objectives. Improvement in financial performance expected over the period, although continued losses means reliance on debt in the short to medium term. A negative result indicates that insufficient revenue is being generated to fund operations and asset renewal.
2 Working Capital – The proportion of current liabilities represented by current assets. Working capital is forecast to improve significantly in 2014/15 year due to the taking of a loan. The trend in later years is to continually improve. A result less than 100% indicates there is insufficient current assets to cover liabilities.
3 Debt compared to rates - Trend indicates Council's initial reliance on debt to manage its cash position. A figure greater than 60% is generally considered there is risk over councils ability to repay debt from own-source revenue.
4 Asset renewal - This percentage indicates the extent of Council's renewals against its depreciation charge (an indication of the decline in value of its existing capital assets). A percentage greater than 100 indicates Council is maintaining its existing assets, while a percentage less than 100 means its assets are deteriorating faster than they are being renewed and future capital expenditure will be required to renew assets. The recent injection of works due to flood recovery means council can manage a lower level in the short term. This trend should be reversed in future years.
5 Rates concentration - Reflects extent of reliance on rate revenues to fund all of Council's on-going services. Trend indicates Council will continue to be reliant on rate revenue compared to all other revenue sources.
8.4 Non-financial resources
In addition to the financial resources to be consumed over the planning period, Council will also consume non-financial resources, in particular human resources. A summary of Council’s anticipated human resources requirements for the 2014/15 year is shown below and further detail is included in section 4.3.1 of this budget. A statement of Human Resources is included in Appendix A.
|
|
|
Forecast |
Budget |
Strategic Resource Plan |
||
|
Indicator |
2013/14 |
2014/15 |
2015/16 |
2016/17 |
2017/18 |
|
|
Employee costs ($'000) |
|
|
|
|
|
|
|
- Operating |
10,107 |
10,135 |
9,029 |
9,255 |
9,486 |
|
|
- Capital |
300 |
235 |
250 |
250 |
250 |
|
|
Total |
10,407 |
10,370 |
9,279 |
9,505 |
9,736 |
|
|
Employee numbers (EFT) |
138 |
133.6 |
115 |
115 |
115 |
|
Buloke Shire Council Special Meeting Wednesday, 25 June 2014
5.1.1 Adoption of Budget for Municipal Year Ending 30 June 2015
Attachment 1 Draft 2014-15 Budget for Adoption
9. Rating information
This section contains information on Council’s past and foreshadowed rating levels along with Council's rating principles and the impact of changes in property valuations.
9.1 Rating context
In developing the Strategic Resource Plan (referred to in Section 8.), rates and charges were identified as an important source of revenue, accounting for 64% of the total revenue received by Council annually. Planning for future rate increases has therefore been an important component of the Strategic Resource Planning process. The level of required rates and charges has been considered in this context, with reference to Council's other sources of income and the planned expenditure on services and works to be undertaken for the Victorian community.
However, it has also been necessary to balance the importance of rate revenue as a funding source with community sensitivity to increases. To ensure that deliberations about future rate increases have been made on an informed basis, comparisons of rating levels were made between Council and other similar sized councils. The following table shows a comparison of the last five years and the average rates per capita for the 2013/14 year.
The following selective
benchmarking is based on comparing Buloke Shire with like size Councils in
terms of population and geographic character.
|
Council |
Rates as % of Total Revenue |
Mun. Charge
$ |
Garbage Charge
$ |
Total Rev from Garbage Charge $ |
Rates per capita
$ |
Rates per Assess.
$ |
Rates per sq km.
$ |
|
Buloke |
64% |
130 |
255 |
850,000 |
1,642 |
1,683 |
1,309 |
|
Hindmarsh |
43% |
176 |
266 |
699,000 |
1,189 |
1,362 |
915 |
|
Loddon |
40% |
178 |
277 |
843,000 |
1,157 |
1,133 |
1,290 |
|
Pyrenees |
40% |
Nil |
257 |
844,000 |
1,148 |
1,325 |
2,237 |
|
Towong |
59% |
230 |
383 |
987,000 |
1,118 |
1,413 |
987 |
|
Wimmera |
40% |
121 |
243 |
318,000 |
1,418 |
1,296 |
662 |
|
Yarriambiack |
52% |
60 |
411 |
902,000 |
1,411 |
1,465 |
1,368 |
|
Average |
48% |
149 |
299 |
778,000 |
1,298 |
1,382 |
1,252 |
Benchmarking Observations
When benchmarked with the six small rural Councils deemed similar in terms of population and geographic area and nature, the following broad observations result:
· Buloke is significantly more reliant on rates and charges revenue as a % of total revenue than all the other Councils and is 16% above the base average
· Buloke’s municipal charge is the third lowest of the seven benchmarked Councils and is 13% below the base average
· Buloke’s garbage charge is the second lowest and is 15% below the base average
· Buloke has the highest ‘rates per capita’ and is 27% higher than the base average
· Buloke has the highest ‘rates per assessment’ and is 22% higher than the base average
· Buloke has the second highest ‘rates per sq. km’ and is 5% higher than the base average.
It can be concluded that Buloke Shire ratepayers are at the higher end of comparative rate payments but pay below the base averages for both the municipal charge and garbage charges.
9.2 Current year rate
To achieve future revenue growth while containing costs in order to achieve an almost breakeven operating position by 2017/18 as set out in the Strategic Resource Plan. The $1.6 million contribution from operations toward capital investment for the 2014/15 year is also much less than the desired levels, unless it can be increased, it will be difficult to maintain robust capital works programs in the future.
In order to achieve these objectives and be able to generate enough cash for capital works, the general rate will increase by a 6.0%, the municipal charge by 15.3%, the kerbside waste and recyclable collection charge by 49%. This will raise total rate and charges for 2014/15 of $11.45 million. Council’s kerbside waste and and recycling charges have increased by more than the general rate due to a review of the charge levels against the cost to deliver the service.
The following table sets out future proposed increases in rates and charges and the total rates to be raised, based on the forecast financial position of Council as at 30 June 2014.
|
|
General Rate |
Municipal Charge |
Garbage Charge |
Total Rates |
|
Year |
Increase |
Increase |
Increase |
Raised |
|
|
% |
% |
% |
$’000 |
|
2013/14 |
6.0 |
30.0 |
6.3 |
10,446 |
|
2014/15 |
6.0 |
15.4 |
49.0 |
11,453 |
|
2015/16 |
6.0 |
6.0 |
2.5 |
12,102 |
|
2016/17 |
6.0 |
6.0 |
2.5 |
12,788 |
|
2017/18 |
6.0 |
6.0 |
2.5 |
13,515 |
9.3 Rating structure
Council has established a rating structure which is comprised of three key elements. These are:
· Property values, which form the central basis of rating under the Local Government Act 1989
· A 'user pays' component to reflect usage of certain services provided by Council
· A fixed municipal charge per property to cover some of the administrative costs of the Council.
Striking a proper balance between these elements provides equity in the distribution of the rate burden across residents.
Council makes a further distinction within the property value component of rates based on the purpose for which the property is used, that is, whether the property is used for residential or commercial or farming purposes.
Council has determined to apply a Capital Improved Value (CIV) basis on the grounds that it provides the most equitable distribution of rates across the municipality. There are currently no plans to change that basis, but Council does review its rating structure every four years.
The existing rating structure comprises three differential rates (residential, commercial and farm). These rates are structured in accordance with the requirements of Section 161 ‘Differential Rates’ of the Act.
The following principles have been applied to the development of Council’s rates:
1. The 2014 Revaluation will be used for rating purposes in 2014/15.
2. The basis of valuation will continue to be the Capital Improved Value (CIV).
3. An increase in revenue from rates in 2014/15 of 6%.
4. The Municipal Charge to be retained and applied to every rateable property in the Shire. However, a single farm enterprise which may be conducted on several properties can apply for an exemption which will mean that they will only be charged one Municipal Charge for that enterprise.
5. The amount of rate revenue collected through the Municipal Charge to increase to represent 6.5% of the total revenue raised through General Rates and Service Charges.
6. The Commercial/Industrial Rate to be set at 100% of the General Rate.
7. The Farm Rate to be set at 98% of the General Rate (A Farm rate differential of 2%).
8. The current kerbside waste and recyclable services will be retained and increased to recover 100% of the costs incurred by Council to provide the service and operate land fill and transfer stations across the Shire, including Government levies.
9. The charge for a waste and recyclable service will apply equally to all occupied residential properties where the service is rendered, or is available, whether or not the service is used.
10. A pensioner concession for eligible concession card holders will provide a 50% discount off Council rates up to the maximum amount set by the Victorian Government.
The following table summarises the rates to be determined for the 2014/15 year. A more detailed analysis of the rates to be raised is contained in Appendix B ‘Statutory Disclosures’.
|
Rate type |
How applied |
2013/14 |
2014/15 |
Change |
|
Residential rates |
Cents in $ of CIV |
0.007621 |
0.007606 |
-0.2% |
|
Commercial rates |
Cents in $ of CIV |
0.007621 |
0.007606 |
-0.2% |
|
Farm rates |
Cents in $ of CIV |
0.007469 |
0.007455 |
-0.2% |
|
Municipal charge |
$ per property |
$130 |
$150 |
15.3% |
|
Kerbside collection charge |
$ per property |
$255 |
$380 |
49% |
9.4 General revaluation of properties
During the 2013/14 year, a revaluation of all properties within the municipality was carried out and will apply from 1 January 2014 for the 2014/15 year. The outcome of the general revaluation has been an increase in property valuations throughout the municipality. Overall, property valuations across the municipal district have increased by 5%.
|
Catagory |
CIV 2013/14 $’000 |
CIV 2014/15 $’000 |
CIV Change (Decrease) |
|
Average Residential |
291,475 |
305,700 |
4.9% |
|
Average Commercial |
70,810 |
77,213 |
9.0% |
|
Average Farm |
840,432 |
885,497 |
5.4% |
|
Average total |
1,202,717 |
1,268,410 |
5.5% |
In view of the outcomes of the general revaluation of all properties within the Council’s municipal district during the 2013/14 year, Council has chosen not to make any changes to the existing rate differential. In aggregate total rates and charges will increase by 6.0% compared to 2013/14. This will be achieved by reducing the rate in the dollar to offset the 5.5% increase in property valuations across the municipal district following the general revaluation.
Buloke Shire Council Special Meeting Wednesday, 25 June 2014
5.1.1 Adoption of Budget for Municipal Year Ending 30 June 2015
Attachment 1 Draft 2014-15 Budget for Adoption
10. Other Strategies
This section sets out summaries of the borrowing strategy and service reviews that have been developed and incorporated into the Strategic Resource Plan (SRP).
10.1 Borrowing Strategy
In developing the SRP (see Section 8), borrowings were identified as an important funding source to manage the deficit cash position Council is faced with in the short to medium term.
Council borrowed $1.55 million in 2013/14 to pay out the remaining amount of superannuation liability. This loan was for a 2 year period with the final repayment to be made in the 2015/16 year.
A loan of $7.0 million dollars is included in the Budget for 2014/15. This loan will assist Council to operate in a cash surplus position throughout the year, minimising the need to call on overdraft provisions. An interest only loan for a five year period is proposed to minimise the draw on Council’s cash position during this time. The SRP indicates that Council will have a healthy cash position at this time to enable strategic decisions to be made regarding the future requirements of Council’s loan position.
The following table sets out future proposed borrowings, based on the forecast financial position of Council as at 30 June 2014.
|
Year |
New Borrowings |
Principal |
Interest |
Balance 30 June |
|
|
$’000 |
$’000 |
$’000 |
$’000 |
|
2013/14 |
1550 |
565 |
130 |
985 |
|
2014/15 |
7,000 |
782 |
376 |
7,203 |
|
2015/16 |
0 |
203 |
340 |
7,000 |
|
2016/17 |
0 |
0 |
340 |
7,000 |
|
2017/18 |
0 |
0 |
340 |
7,000 |
The table below shows information on borrowings specifically required by the Regulations.
|
|
2013/14 |
2014/15 |
|
$ |
$ |
|
|
Total amount borrowed as at 30 June of the prior year |
0 |
985,000 |
|
Total amount to be borrowed |
1,550,000 |
7,000,000 |
|
Total amount projected to be redeemed |
(565,000) |
(782,000) |
|
Total amount proposed to be borrowed as at 30 June |
985,000 |
7,203,000 |
10.2 Service Reviews
During the preparation of the 2014/15 Budget, Council has implemented a range of initiatives to address the long term financial sustainability of the Council which followed a detailed review of services. This review was as a result of the poor financial health of the Council and in response to the Ernst & Young report - Independent Assessment: Current and Future Financial Health of the Buloke Shire Council. This report identified that
“...the financial health of the Buloke Shire at 30 June 2011 was very poor and required significant, strategic action to address the immediate and long term sustainability of the Shire”
The report made three high impact recommendations:
1. Cashflow management and financial reporting:
Monthly cashflow reports are now prepared and reported to council which show a rolling 12 month forecast. The information provided to Council has allowed council to make critical short term decisions to manage cashflow which included increased sundry debtor works on flood reconstruction works, securing advanced funding for flood reconstruction works and restricting expenditure. The 2014/15 Budget and Strategic resource Plan implements a range of structural issues to manage cashflow in the medium to long term. These include loan borrowings and expenditure savings in both operating and capital budgets.
2. Assessment of services/spending – cost v benefit analysis.
A review of Council services has been a major focus in the development of the 2014/15 Budget. This has involved the identification of service profiles, resources used to deliver the services and consideration of options to drive long term structural savings in the budget. It was identified that a reduction of $4.0 million from operating budget of Council is the objective to improve councils financial position. The service reviews have identified $ 3.34 million reduction in operating expenditure, to be implemented over a 2 year period. It is recognised that further savings will be required through efficiency improvements. A summary of the results of the service reviews are shown in Appendix E.
3. Council consideration of updated forecasts for sustainability.
Updated forecasts are provided for in the 2014/15 Budget document and have been a basis for the financial strategies adopted in this Budget.
Critically, Council has approached the development of the 2014/15 Budget and service reviews with the following principles:
· Rationalisation of service levels will be a key driver of long term financial sustainability.
· Detailed financial analysis and reporting of the council financial position are essential in facilitating sustainable decision making.
· Councillors, with support of management are in a position to make decisions that will influence the long term sustainability of the Council.
Buloke Shire Council Special Meeting Wednesday, 25 June 2014
5.1.1 Adoption of Budget for Municipal Year Ending 30 June 2015
Attachment 1 Draft 2014-15 Budget for Adoption
Appendices
The following appendices include voluntary and statutory disclosures of information which provide support for the analysis contained in sections 1 to 10 of this report.
This information has not been included in the main body of the budget report in the interests of clarity and conciseness. Council has decided that while the budget report needs to focus on the important elements of the budget and provide appropriate analysis, the detail upon which the annual budget is based should be provided in the interests of open and transparent local government.
The contents of the appendices are summarised below:
|
Appendix |
Nature of information |
Page |
|
51 |
||
|
Rates and charges |
58 |
|
|
63 |
||
|
D |
Fees and charges schedule |
69 |
|
E |
Service Review Outcomes |
79 |
Buloke Shire Council Special Meeting Wednesday, 25 June 2014
5.1.1 Adoption of Budget for Municipal Year Ending 30 June 2015
Attachment 1 Draft 2014-15 Budget for Adoption
Appendix A
Budgeted Statements
This appendix presents information in regard to the Budgeted Financial Statements and Statement of Human Resources. The budget information for the years 2014/15 to 2017/18 has been extracted from the Strategic Resource Plan.
At the end of each financial year Council is required to include in the Financial Statements in its Annual Report a comparison of actual income and expenditure compared with the income and expenditure in the financial statements in the Budget,
The appendix includes the following budgeted information:
· Budgeted Comprehensive Income Statement
· Budgeted Balance Sheet
· Budgeted Statement of Changes in Equity
· Budgeted Statement of Cash Flows
· Budgeted Statement of Capital Works
· Budgeted Statement of Human Resources
Buloke Shire Council Special Meeting Wednesday, 25 June 2014
5.1.1 Adoption of Budget for Municipal Year Ending 30 June 2015
Attachment 1 Draft 2014-15 Budget for Adoption
Budgeted Comprehensive Income Statement
For the four years ending 30 June 2018
|
|
Forecast Actual |
Budget |
Strategic Resource Plan |
||
|
Projections |
|||||
|
|
2013/14 |
2014/15 |
2015/16 |
2016/17 |
2017/18 |
|
|
$’000 |
$’000 |
$’000 |
$’000 |
$’000 |
|
Income |
|
|
|
|
|
|
Rates and charges |
10,446 |
11,453 |
12,102 |
12,788 |
13,515 |
|
Statutory fees and fines |
86 |
84 |
86 |
88 |
90 |
|
User fees |
709 |
744 |
762 |
781 |
801 |
|
Contributions - cash |
589 |
132 |
157 |
157 |
157 |
|
Contributions - non-monetary assets |
0 |
0 |
0 |
0 |
0 |
|
Grants - operating (recurrent) |
3,796 |
6,653 |
6,682 |
6,682 |
6,849 |
|
Grants - operating (non-recurrent) |
149 |
12 |
13 |
13 |
14 |
|
Grants - capital (recurrent) |
0 |
1,000 |
1,000 |
1,000 |
1,000 |
|
Grants - capital (non-recurrent) |
40,350 |
4,969 |
3,000 |
3,000 |
3,000 |
|
Net gain on disposal of property, infrastructure, plant and equipment |
14 |
10 |
10 |
10 |
10 |
|
Other income |
1,039 |
262 |
210 |
217 |
224 |
|
Fair value adjustments for investment property |
0 |
0 |
0 |
0 |
0 |
|
Share of net profits/(losses) of associated and joint ventures accounted for by the equity method |
0 |
0 |
0 |
0 |
0 |
|
Total income |
57,178 |
25,319 |
24,022 |
24,737 |
25,660 |
|
|
|
|
|
|
|
|
Expenses |
|
|
|
|
|
|
Employee costs |
10,107 |
10,135 |
9,029 |
9,255 |
9,486 |
|
Materials and services |
6,583 |
5,785 |
4,600 |
4,738 |
4,880 |
|
Bad and doubtful debts |
13 |
11 |
11 |
11 |
12 |
|
Depreciation and amortisation |
7,707 |
7,334 |
7,334 |
7,332 |
7,330 |
|
Finance costs |
127 |
376 |
339 |
337 |
337 |
|
Other expenses |
874 |
729 |
753 |
774 |
797 |
|
Total expenses |
25,411 |
24,370 |
22,066 |
22,447 |
22,842 |
|
Surplus (deficit) |
31,767 |
949 |
1,956 |
2,290 |
2,818 |
|
|
|
|
|
|
|
|
Other comprehensive income |
|
|
|
|
|
|
Items that will not be reclassified to surplus or deficit: |
0 |
0 |
0 |
0 |
0 |
|
Impairment of fire impacted infrastructure |
(10,102) |
0 |
0 |
0 |
0 |
|
Net asset revaluation increment /(decrement) |
|
|
|
|
|
|
Share of other comprehensive income of associates and joint ventures accounted for by the equity method |
0 |
0 |
0 |
0 |
0 |
|
Total comprehensive result |
21,665 |
949 |
1,956 |
2,290 |
2,818 |
|
|
|
|
|
|
|
|
|
|
|
|
|
|
Buloke Shire Council Special Meeting Wednesday, 25 June 2014
5.1.1 Adoption of Budget for Municipal Year Ending 30 June 2015
Attachment 1 Draft 2014-15 Budget for Adoption
Budgeted Balance Sheet
For the four years ending 30 June 2018
|
|
Forecast Actual |
Budget |
Strategic Resource Plan |
||
|
|
|
|
Projections |
||
|
|
2014 |
2015 |
2016 |
2017 |
2018 |
|
|
$’000 |
$’000 |
$’000 |
$’000 |
$’000 |
|
Assets |
|
|
|
|
|
|
Current assets |
|
|
|
|
|
|
Cash and cash equivalents |
(4,146) |
15 |
2,278 |
5,845 |
9,996 |
|
Trade and other receivables |
1,210 |
1,223 |
1,208 |
1,236 |
1,281 |
|
Financial assets |
0 |
0 |
0 |
0 |
0 |
|
Inventories |
0 |
0 |
0 |
0 |
0 |
|
Other assets |
151 |
151 |
151 |
151 |
151 |
|
Total current assets |
(2,785) |
1,389 |
3,637 |
7,232 |
11,428 |
|
|
|
|
|
|
|
|
Non-current assets |
|
|
|
|
|
|
Trade and other receivables |
0 |
0 |
0 |
0 |
0 |
|
Investments in regional library corporation |
186 |
186 |
186 |
186 |
186 |
|
Property, infrastructure, plant & equipment |
180,772 |
181,335 |
179,986 |
178,639 |
177,292 |
|
Investment property |
0 |
0 |
0 |
0 |
0 |
|
Intangible assets |
0 |
0 |
0 |
0 |
0 |
|
Total non-current assets |
180,958 |
181,521 |
180,172 |
178,825 |
177,478 |
|
Total assets |
178,173 |
182,910 |
183,809 |
186,057 |
188,906 |
|
|
|
|
|
|
|
|
Liabilities |
|
|
|
|
|
|
Current liabilities |
|
|
|
|
|
|
Trade and other payables |
4,649 |
2,219 |
1,364 |
1,322 |
1,355 |
|
Trust funds and deposits |
116 |
116 |
116 |
116 |
116 |
|
Provisions |
2,194 |
2,194 |
2,194 |
2,194 |
2,194 |
|
Interest-bearing loans and borrowings |
985 |
203 |
0 |
0 |
0 |
|
Total current liabilities |
7,944 |
4,732 |
3,674 |
3,632 |
3,665 |
|
|
|
|
|
|
|
|
Non-current liabilities |
|
|
|
|
|
|
Provisions |
1,535 |
1,535 |
1,535 |
1,535 |
1,535 |
|
Interest-bearing loans and borrowings |
0 |
7,000 |
7,000 |
7,000 |
7,000 |
|
Total non-current liabilities |
1,535 |
8,535 |
8,535 |
8,535 |
8,535 |
|
Total liabilities |
9,479 |
13,267 |
12,209 |
12,167 |
12,200 |
|
Net assets |
168,694 |
169,643 |
171,599 |
173,889 |
176,706 |
|
|
|
|
|
|
|
|
Equity |
|
|
|
|
|
|
Accumulated surplus |
82,647 |
83,596 |
85,552 |
87,842 |
90,659 |
|
Reserves |
86,047 |
86,047 |
86,047 |
86,047 |
86,047 |
|
Total equity |
168,694 |
169,643 |
171,599 |
173,889 |
176,706 |
Buloke Shire Council Special Meeting Wednesday, 25 June 2014
5.1.1 Adoption of Budget for Municipal Year Ending 30 June 2015
Attachment 1 Draft 2014-15 Budget for Adoption
Budgeted Statement of Changes in Equity
For the four years ending 30 June
|
Total |
Accumulated Surplus |
Revaluation Reserve |
Other Reserves |
|
|
$’000 |
$’000 |
$’000 |
$’000 |
|
|
2015 |
|
|
|
|
|
Balance at beginning of the financial year |
168,694 |
82,647 |
86,047 |
0 |
|
Adjustment on change in accounting policy |
- |
- |
- |
- |
|
Comprehensive result |
949 |
949 |
- |
|
|
Net asset revaluation increment(decrement) |
- |
- |
- |
- |
|
Impairment losses on revalued assets |
- |
- |
- |
- |
|
Reversal of impairment losses on revalued assets |
- |
- |
- |
- |
|
Transfer to reserves |
- |
- |
- |
- |
|
Transfer from reserves |
- |
- |
- |
- |
|
Balance at end of the financial year |
169,643 |
83,596 |
86,047 |
0 |
|
|
|
|
|
|
|
2016 |
|
|
|
|
|
Balance at beginning of the financial year |
169,643 |
83,596 |
86,047 |
0 |
|
Adjustment on change in accounting policy |
- |
- |
- |
- |
|
Comprehensive result |
1,956 |
1,956 |
- |
- |
|
Net asset revaluation increment(decrement) |
- |
- |
- |
- |
|
Impairment losses on revalued assets |
- |
- |
- |
- |
|
Reversal of impairment losses on revalued assets |
- |
- |
- |
- |
|
Transfer to reserves |
- |
- |
- |
- |
|
Transfer from reserves |
- |
- |
- |
- |
|
Balance at end of the financial year |
171,599 |
85,552 |
86,047 |
0 |
|
|
|
|
|
|
|
2017 |
|
|
|
|
|
Balance at beginning of the financial year |
171,599 |
85,552 |
86,047 |
0 |
|
Adjustment on change in accounting policy |
- |
- |
- |
- |
|
Comprehensive result |
2,290 |
2,290 |
- |
- |
|
Net asset revaluation increment(decrement) |
- |
- |
- |
- |
|
Impairment losses on revalued assets |
- |
- |
- |
- |
|
Reversal of impairment losses on revalued assets |
- |
- |
- |
- |
|
Transfer to reserves |
- |
- |
- |
- |
|
Transfer from reserves |
- |
- |
- |
- |
|
Balance at end of the financial year |
173,889 |
87,842 |
86,047 |
0 |
|
|
|
|
|
|
|
2018 |
|
|
|
|
|
Balance at beginning of the financial year |
173,889 |
87,842 |
86,047 |
0 |
|
Adjustment on change in accounting policy |
- |
- |
- |
- |
|
Comprehensive result |
2,818 |
2,818 |
- |
- |
|
Net asset revaluation increment(decrement) |
- |
- |
- |
- |
|
Impairment losses on revalued assets |
- |
- |
- |
- |
|
Reversal of impairment losses on revalued assets |
- |
- |
- |
- |
|
Transfer to reserves |
- |
- |
- |
- |
|
Transfer from reserves |
- |
- |
- |
- |
|
Balance at end of the financial year |
176,706 |
90,659 |
86,047 |
0 |
Budgeted Statement of Cash Flows
For the four years ending 30 June 2018
|
|
Forecast Actual |
Budget |
Strategic Resource Plan |
||
|
|
|
|
Projections |
||
|
|
2013/14 |
2014/15 |
2015/16 |
2016/17 |
2017/18 |
|
|
|
$’000 |
$’000 |
$’000 |
$’000 |
$’000 |
|
|
|
Inflows |
Inflows |
Inflows |
Inflows |
Inflows |
|
|
|
(Outflows) |
(Outflows) |
(Outflows) |
(Outflows) |
(Outflows) |
|
|
Cash flows from operating activities |
|
|
|
|
|
|
|
Rates and charges |
10,400 |
11,440 |
12,103 |
12,768 |
13,485 |
|
|
Statutory fees and fines |
87 |
115 |
86 |
88 |
90 |
|
|
User fees |
727 |
712 |
762 |
780 |
799 |
|
|
Contributions |
589 |
132 |
132 |
132 |
132 |
|
|
Grants - operating |
3,944 |
6,665 |
6,682 |
6,682 |
6,849 |
|
|
Grants - capital |
40,350 |
5,969 |
4,000 |
4,000 |
4,000 |
|
|
Interest |
70 |
50 |
53 |
56 |
59 |
|
|
Other receipts |
338 |
339 |
198 |
182 |
179 |
|
|
Net GST refund / payment |
0 |
0 |
0 |
0 |
0 |
|
|
Employee costs |
(10,418) |
(10,134) |
(9,566) |
(9,281) |
(9,466) |
|
|
Materials and consumables |
(6,626) |
(5,785) |
(4,874) |
(4,752) |
(4,870) |
|
|
External contracts |
0 |
0 |
0 |
0 |
0 |
|
|
Utilities |
0 |
0 |
0 |
0 |
0 |
|
|
Other payments |
(874) |
(729) |
(796) |
(776) |
(795) |
|
|
Net cash provided by operating activities |
38,587 |
8,774 |
8,780 |
9,879 |
10,463 |
|
|
|
|
|
|
|
|
|
|
Cash flows from investing activities |
|
|
|
|
|
|
|
Payments for property, infrastructure, plant and equipment |
(44,146) |
(10,465) |
(6,000) |
(6,000) |
(6,000) |
|
|
Proceeds from sale of property, infrastructure, plant and equipment |
24 |
10 |
25 |
25 |
25 |
|
|
Trust funds and deposits |
0 |
0 |
0 |
0 |
0 |
|
|
Repayment of loans and advances |
(1,582) |
0 |
0 |
0 |
0 |
|
|
Net cash used in investing activities |
(45,704) |
(10,455) |
(5,975) |
(5,975) |
(5,975) |
|
|
|
|
|
|
|
|
|
|
Cash flows from financing activities |
|
|
|
|
|
|
|
Finance costs |
(130) |
(376) |
(339) |
(337) |
(337) |
|
|
Proceeds from borrowings |
1,550 |
7,000 |
0 |
0 |
0 |
|
|
Repayment of borrowings |
(565) |
(782) |
(203) |
0 |
0 |
|
|
Net cash provided by (used in) financing activities |
855 |
5,842 |
(542) |
(337) |
(337) |
|
|
Net (decrease) increase in cash and cash equivalents |
(6,262) |
4,161 |
2,263 |
3,567 |
4,151 |
|
|
Cash and cash equivalents at beginning of the financial year |
2,116 |
(4,146) |
15 |
2,278 |
5,845 |
|
|
Cash and cash equivalents at end of the financial year |
(4,146) |
15 |
2,278 |
5,845 |
9,996 |
|
|
|
|
|
|
|
|
|
Budgeted Statement of Capital Works
For the four years ending 30 June 2018
|
|
Forecast Actual |
Budget |
Strategic Resource Plan |
||||
|
|
|
|
Projections |
||||
|
|
2013/14 |
2014/15 |
2015/16 |
2016/17 |
2017/18 |
|||
|
|
$’000 |
$’000 |
$’000 |
$’000 |
$’000 |
|||
|
Property |
|
|
|
|
|
|||
|
Land |
0 |
0 |
0 |
0 |
0 |
|||
|
Land improvements |
0 |
0 |
0 |
0 |
0 |
|||
|
Total land |
0 |
0 |
0 |
0 |
0 |
|||
|
Buildings |
2,766 |
2,703 |
0 |
0 |
0 |
|||
|
Building improvements |
0 |
0 |
700 |
700 |
700 |
|||
|
Leasehold improvements |
0 |
0 |
0 |
0 |
0 |
|||
|
Heritage buildings |
0 |
0 |
300 |
300 |
300 |
|||
|
Total buildings |
2,766 |
2,703 |
1,000 |
1,000 |
1,000 |
|||
|
Total property |
2,766 |
2,703 |
1,000 |
1,000 |
1,000 |
|||
|
Plant and equipment |
|
|
|
|
|
|||
|
Plant, machinery and equipment |
740 |
760 |
760 |
760 |
760 |
|||
|
Fixtures, fittings and furniture |
364 |
150 |
150 |
150 |
150 |
|||
|
Computers and telecommunications |
0 |
0 |
500 |
500 |
500 |
|||
|
Heritage plant and equipment |
0 |
0 |
0 |
0 |
0 |
|||
|
Library books |
0 |
0 |
0 |
0 |
0 |
|||
|
Total plant and equipment |
1,104 |
910 |
1,410 |
1,410 |
1,410 |
|||
|
Infrastructure |
|
|
|
|
|
|||
|
Roads |
42,762 |
1,494 |
3,590 |
3,590 |
3,590 |
|||
|
Bridges |
158 |
485 |
0 |
0 |
0 |
|||
|
Footpaths and cycleways |
0 |
94 |
0 |
0 |
0 |
|||
|
Drainage |
0 |
1,675 |
0 |
0 |
0 |
|||
|
Recreational, leisure and community facilities |
0 |
0 |
0 |
0 |
0 |
|||
|
Waste management |
73 |
190 |
0 |
0 |
0 |
|||
|
Parks, open space and streetscapes |
0 |
0 |
0 |
0 |
0 |
|||
|
Aerodromes |
0 |
10 |
0 |
0 |
0 |
|||
|
Off street car parks |
0 |
0 |
0 |
0 |
0 |
|||
|
Other infrastructure |
63 |
222 |
0 |
0 |
0 |
|||
|
Total infrastructure |
43,056 |
4,170 |
3,590 |
3,590 |
3,590 |
|||
|
Total capital works expenditure |
46,926 |
7,783 |
6,000 |
6,000 |
6,000 |
|||
|
|
|
|
|
|
|
|||
|
Represented by: |
|
|
|
|
|
|||
|
New asset expenditure |
1,131 |
2,042 |
0 |
0 |
0 |
|||
|
Asset renewal expenditure |
45,527 |
4,085 |
6,000 |
6,000 |
6,000 |
|||
|
Asset expansion expenditure |
0 |
0 |
0 |
0 |
0 |
|||
|
Asset upgrade expenditure |
268 |
1656 |
0 |
0 |
0 |
|||
|
Total capital works expenditure |
46,926 |
7,783 |
6,000 |
6,000 |
6,000 |
|||
|
|
|
|
|
|
|
|||
Budgeted Statement of Human Resources
For the four years ending 30 June 2018
|
|
Forecast Actual |
Budget |
Strategic Resource Plan |
|||
|
|
|
|
Projections |
|||
|
|
2013/14 |
2014/15 |
2015/16 |
2016/17 |
2017/18 |
|
|
|
|
$’000 |
$’000 |
$’000 |
$’000 |
$’000 |
|
|
|
Staff expenditure |
|
|
|
|
|
|
|
|
Employee costs - operating |
10,107 |
10,135 |
9,029 |
9,255 |
9,486 |
|
|
|
Employee costs - capital |
300 |
235 |
250 |
250 |
250 |
|
|
|
Total staff expenditure |
10,407 |
10,370 |
9,279 |
9,505 |
9,736 |
|
|
|
|
|
|
|
|
|
|
|
|
|
EFT |
EFT |
EFT |
EFT |
EFT |
|
|
|
Staff numbers |
|
|
|
|
|
|
|
|
Total staff numbers |
138 |
133.6 |
115 |
115 |
115 |
|
|
Buloke Shire Council Special Meeting Wednesday, 25 June 2014
5.1.1 Adoption of Budget for Municipal Year Ending 30 June 2015
Attachment 1 Draft 2014-15 Budget for Adoption
Appendix B
Rates and charges
This appendix presents information about rates and charges which the Act and the Regulations require to be disclosed in the Council’s annual budget.
Rates and charges
1. Rates and charges
1.1 The rate in the dollar to be levied as general rates under section 158 of the Act for each type or class of land compared with the previous financial year
|
Type or class of land |
2013/14 |
2014/15 |
|
|
cents/$CIV |
cents/$CIV |
Change |
|
|
General rate for rateable residential properties |
0.007621 |
0.007606 |
-0.2% |
|
General rate for rateable commercial properties |
0.007621 |
0.007606 |
-0.2% |
|
General rate for rateable farming properties |
0.007469 |
0.007455 |
-0.2% |
1.2 The estimated total amount to be raised by general rates in relation to each type or class of land, and the estimated total amount to be raised by general rates, compared with the previous financial year
|
Type or class of land |
2013/14 |
2014/15 |
|
|
$ |
$ |
Change |
|
|
Residential |
2,221,551 |
2,325,280 |
4.7% |
|
Commercial |
540,380 |
587,312 |
8.7% |
|
Farming |
6,275,341 |
6,601,408 |
5.2% |
|
Total amount to be raised by general rates |
9,037,272 |
9,514,000 |
5.3% |
1.3 The number of assessments in relation to each type or class of land, and the total number of assessments, compared with the previous financial year
|
Type or class of land |
2013/14 |
2014/15 |
|
|
$ |
$ |
Change |
|
|
Residential |
2,881 |
2,881 |
0 |
|
Commercial |
453 |
451 |
-2 |
|
Farming |
2,850 |
2,854 |
3 |
|
Total number of assessments |
6,184 |
6,186 |
2 |
1.4 The basis of valuation to be used is the Capital Improved Value (CIV)
1.5 The estimated total value of each type or class of land, and the estimated total value of land, compared with the previous financial year
|
Type or class of land |
2013/14 |
2014/15 |
Change |
|
$ |
$ |
|
|
|
Residential |
291,475,800 |
305,700,600 |
4.9% |
|
Commercial |
70,810,600 |
77,212,900 |
9.0% |
|
Farming |
840,432,250 |
885,497,200 |
5.4% |
|
Total value of land |
1,202,718,650 |
1,268,410,700 |
5.5% |
1.6 The municipal charge under section 159 of the Act compared with the previous financial year
|
|
Per Rateable Property |
Per Rateable Property |
|
|
Type of Charge |
2013/14 |
2014/15 |
Change |
|
|
$ |
$ |
|
|
Municipal |
130 |
150 |
15.4% |
1.7 The estimated total amount to be raised by municipal charges compared with the previous financial year
|
Type of Charge |
2013/14 |
2014/15 |
Change |
|
$ |
$ |
|
|
|
Municipal |
569,671 |
657,000 |
15.3% |
1.8 The rate or unit amount to be levied for each type of service rate or charge under section 162 of the Act compared with the previous financial year
|
|
Per Rateable Property |
Per Rateable Property |
|
|
Type of Charge |
2013/14 |
2014/15 |
Change |
|
|
$ |
$ |
|
|
Kerbside Garbage & Recycling collection |
255 |
380 |
49.0% |
1.9 The estimated total amount to be raised by each type of service rate or charge, and the estimated total amount to be raised by service rates and charges, compared with the previous financial year
|
Type of Charge |
2013/14 |
2014/15 |
Change |
|
$ |
$ |
|
|
|
Kerbside Garbage & Recycling collection |
852,432 |
1,282,120 |
50.4% |
1.10 The estimated total amount to be raised by the General rates and municipal charges compared with the previous financial year
|
|
2013/14 |
2014/15 |
Change |
|
$ |
$ |
|
|
|
Rates and municipal charges |
9,606,943 |
10,171,000 |
6.0% |
1.11 The estimated total amount to be raised by all rates and charges compared with the previous financial year
|
|
2013/14 |
2014/15 |
Change |
|
$ |
$ |
|
|
|
Rates and all charges |
10,459,375 |
11,453,120 |
9.5% |
1.12 Any significant changes that may affect the estimated amounts to be raised by rates and charges
There are no known significant changes which may affect the estimated amounts to be raised by rates and charges.
2. Differential rates
2.1 Rates to be levied
· A general rate of 0.007606% (0.007606 cents in the dollar of CIV) for all rateable residential and business properties; and
· A concession rate of 0.007455% (0.007455 cents in the dollar of CIV) for all rateable farm properties.
· Each differential rate will be determined by multiplying the Capital Improved Value of rateable land (categorised by the characteristics described below) by the relevant percentages indicated above.
Council believes each differential rate will contribute to the equitable and efficient carrying out of council functions. Details of the objectives of each differential rate, the types of classes of land which are subject to each differential rate and the uses of each differential rate are set out below.
2.2 Business land.
Business land is any land which is:
· Occupied for the principal purpose of carrying out the manufacture or production of, or trade in, goods or services or
· Unoccupied but zoned commercial or industrial under the Buloke Shire Planning Scheme.
The objective of this differential rate is to ensure that all rateable land makes an equitable financial contribution to the cost of carrying out the functions of Council, including (but not limited to) the:
· Construction and maintenance of infrastructure assets
· Development and provision of health and community services
· Provision of general support services.
The types and classes of rateable land within this differential rate are those having the relevant characteristics described above.
The money raised by the differential rate will be applied to the items of expenditure described in the Budget by Council. The level of the rate for land in this category is considered to provide for an appropriate contribution to Council’s budgeted expenditure, having regard to the characteristics of the land.
The geographic location of the land within this differential rate is wherever it is located within the municipal district, without reference to ward boundaries.
The use of the land within this differential rate, in the case of improved land, is any use of land.
The characteristics of planning scheme zoning are applicable to the determination of vacant land which will be subject to the rate applicable to commercial land. The vacant land affected by this rate is that which is zoned commercial and/or industrial under the Shire of Buloke Planning Scheme. The classification of land which is improved will be determined by the occupation of that land, and have reference to the planning scheme zoning.
The types of buildings on the land within this differential rate are all buildings already constructed on the land or which will be constructed prior to the expiry of the 2013/14 financial year.
2.3 Residential land
Residential land is any land, which is:
· Occupied for the principal purpose of physically accommodating persons or
· Unoccupied but zoned residential under the Shire of Buloke Planning Scheme and which is not commercial land.
The objective of this differential rate is to ensure that all rateable land makes an equitable financial contribution to the cost of carrying out the functions of Council, including (but not limited to) the:
· Construction and maintenance of infrastructure assets
· Development and provision of health and community services
· Provision of general support services.
The types and classes of rateable land within this differential rate are those having the relevant characteristics described above.
The money raised by the differential rate will be applied to the items of expenditure described in the Budget by Council. The level of the rate for land in this category is considered to provide for an appropriate contribution to Council’s budgeted expenditure, having regard to the characteristics of the land.
The geographic location of the land within this differential rate is where it is located within the municipal district, without reference to ward boundaries.
The use of the land within this differential rate, in the case of improved land, is any use of land.
The characteristics of planning scheme zoning are applicable to the determination of vacant land which will be subject to the rate applicable to residential land. The vacant land affected by this rate is that which is zoned residential under the Buloke Shire Council Planning Scheme. The classification of land which is improved will be determined by the occupation of that land, and have reference to the planning scheme zoning.
The types of buildings on the land within this differential rate are all buildings already on the land or which will be constructed prior to the expiry of the 2013/14 financial year.
2.4 Farm Land
Farm land is any rateable land:
· That is not less than 2 hectares in area;
· That is used primarily for grazing (including agistment), dairying, pig-farming, poultry farming, fish farming, tree farming, bee keeping, viticulture, horticulture, fruit growing or the growing of crops of any kind or any combination of those activities; and that is used by a business;
· That has significant and substantial commercial purpose or character;
· That seeks to make a profit on a continuous or repetitive basis from its activities on the land;
The types and classes of rateable land within this differential rate are those having the relevant characteristics described above.
The objective of this differential rate is to ensure that all rateable land makes an equitable financial contribution to the cost of carrying out the functions of Council, including (but not limited to) the:
· Construction and maintenance of infrastructure assets;
· Development and provision of health and community services;
· Provision of general support services;
· To maintain agriculture as a major industry in the municipal district; and,
· To ensure that the concessional rate in the dollar declared for defined Farm Land properties is fair and equitable, having regard to the cost of provision of Council services, and the level of benefits derived from expenditures made by Council on behalf of the farm sector.
The money raised by the differential rate will be applied to the items of
expenditure described in the Budget by Council. The level of the rate for land
in this category is considered to provide for an appropriate contribution to
Council’s budgeted expenditure, having regard to the characteristics of the
land.
The geographic location of the land within this differential rate is where it is located within the municipal district, without reference to ward boundaries.
The use of the land within this differential rate, in the case of improved land, is any use of land.
Buloke Shire Council Special Meeting Wednesday, 25 June 2014
5.1.1 Adoption of Budget for Municipal Year Ending 30 June 2015
Attachment 1 Draft 2014-15 Budget for Adoption
Appendix C
Capital works program
This appendix presents a listing of the capital works projects that will be undertaken for the 2014/15 year.
Buloke Shire Council Special Meeting Wednesday, 25 June 2014
5.1.1 Adoption of Budget for Municipal Year Ending 30 June 2015
Attachment 1 Draft 2014-15 Budget for Adoption
Capital works program
For the year ending 30 June 2015
|
|
FUNDING SOURCE |
||||||||
|
ASSET DESCRIPTION |
TOTAL |
RENEWAL |
UPGRADE |
NEW |
EXPANSION |
|
GRANTS |
|
COUNCIL FUNDS |
|
COMMUNITY CONTRIBUTION |
|||||||||
|
|
$ |
$ |
$ |
$ |
|
|
$ |
$ |
$ |
|
LAND & BUILDINGS |
|
|
|
|
|
|
|
|
|
|
Community Facilities |
|
|
|
|
|
|
|
|
|
|
Local Government Infrastructure Program |
|
|
|
|
|
|
461,000 |
|
-461,000 |
|
Hall Renewal Project |
400,000 |
400,000 |
|
|
|
|
300,000 |
|
100,000 |
|
Essential Services Upgrades - Donald, Sea Lake, Birchip Recreation Reserves |
100,000 |
100,000 |
|
|
|
|
|
|
100,000 |
|
|
|
|
|
|
|
|
|
|
|
|
Swimming Pools |
|
|
|
|
|
|
|
|
|
|
Wycheproof Pool - Fit stainless steel ladders |
3,000 |
3,000 |
|
|
|
|
|
|
3,000 |
|
Pool Blankets Berri, Watchem, Wyche, Birchip & Sea Lake Pools |
95,000 |
|
|
95,000 |
|
|
55,000 |
|
40,000 |
|
Connect Backwash lines to sewer Stage 1 (Charl, Don, Wyche, Bir Pools) |
20,000 |
|
20,000 |
|
|
|
|
|
20,000 |
|
Disinfectant upgrades Berriwillock & Watchem Pools (Worksafe) |
35,000 |
|
35,000 |
|
|
|
|
|
35,000 |
|
Municipal Offices |
|
|
|
|
|
|
|
|
|
|
Records Shed Roof Replacement |
9,000 |
9,000 |
|
|
|
|
|
|
9,000 |
|
|
|
|
|
|
|
|
|
|
|
|
Sports Facilities/Parks and Gardens |
|
|
|
|
|
|
|
|
|
|
Birchip Community Gym Upgrade |
66,000 |
|
|
66,000 |
|
|
44,000 |
22,000 |
0 |
|
Wooroonook Lakes Safety Upgrade |
6,162 |
|
|
6,162 |
|
|
1,742 |
|
4,420 |
|
Park Furniture (across shire) |
10,000 |
10,000 |
|
|
|
|
|
|
10,000 |
|
Park watering systems (across shire) |
20,000 |
20,000 |
|
|
|
|
|
|
20,000 |
|
|
FUNDING SOURCE |
|||||||||||
|
ASSET DESCRIPTION |
TOTAL |
RENEWAL |
UPGRADE |
NEW |
EXPANSION |
|
GRANTS |
|
COUNCIL FUNDS |
|||
|
COMMUNITY CONTRIBUTION |
||||||||||||
|
|
$ |
$ |
$ |
$ |
|
|
$ |
$ |
$ |
|||
|
|
|
|
|
|
|
|
|
|
|
|||
|
Other Council Buildings/Infrastructure |
|
|
|
|
|
|
|
|
|
|||
|
Street Light Sustainability Upgrade |
55,000 |
55,000 |
|
|
|
|
|
|
55,000 |
|||
|
|
|
|
|
|
|
|
|
|
|
|||
|
Sub-Total - Land & Buildings |
819,162 |
597,000 |
55,000 |
167,162 |
0 |
|
861,742 |
22,000 |
-64,580 |
|||
|
|
|
|
|
|
|
|
|
|
|
|||
|
FURNITURE, IT & EQUIPMENT |
|
|
|
|
|
|
|
|
|
|||
|
IT & Equipment replacement |
150,000 |
150000 |
|
|
|
|
|
|
150,000 |
|||
|
|
|
|
|
|
|
|
|
|
|
|||
|
Sub-Total - Furn & Equip |
150,000 |
150,000 |
0 |
0 |
|
|
0 |
0 |
150,000 |
|||
|
|
|
|
|
|
|
|
|
|
|
|||
|
PLANT & MACHINERY |
|
|
|
|
|
|
|
|
|
|||
|
Heavy Plant Replacement |
600,000 |
600,000 |
|
|
|
|
|
|
600,000 |
|||
|
Light Fleet Replacement |
150,000 |
150,000 |
|
|
|
|
|
|
150,000 |
|||
|
Small Plant |
10,000 |
10,000 |
|
|
|
|
|
|
10,000 |
|||
|
|
|
|
|
|
|
|
|
|
|
|||
|
Sub-Total - Plant & Machinery |
760,000 |
760,000 |
0 |
0 |
0 |
|
0 |
0 |
760,000 |
|||
|
|
|
|
|
|
|
|
|
|
|
|||
|
INFRASTRUCTURE |
|
|
|
|
|
|
|
|
|
|||
|
Roads - Sealing |
|
|
|
|
|
|
|
|
|
|||
|
Country Roads and Bridges |
|
|
|
|
|
|
1,000,000 |
|
-1,000,000 |
|||
|
Roads to Recovery |
|
|
|
|
|
|
1,000,000 |
|
-1,000,000 |
|||
|
Road Reseal Program |
330,000 |
330,000 |
|
|
|
|
|
|
330,000 |
|||
|
Major Patch Program |
100,000 |
100,000 |
|
|
|
|
|
|
100,000 |
|||
|
|
FUNDING SOURCE |
||||||||||||||||
|
ASSET DESCRIPTION |
TOTAL |
RENEWAL |
UPGRADE |
NEW |
EXPANSION |
|
GRANTS |
|
COUNCIL FUNDS |
||||||||
|
COMMUNITY CONTRIBUTION |
|||||||||||||||||
|
|
$ |
$ |
$ |
$ |
|
|
$ |
$ |
$ |
||||||||
|
|
|
|
|
|
|
|
|
|
|
||||||||
|
Roads - Resheets |
|
|
|
|
|
|
|
|
|
||||||||
|
Thompsons Rd (Watchem West) (ch. 2,640-3,685) |
35,324 |
35,324 |
|
|
|
|
|
|
35,324 |
||||||||
|
Towerhill Road (Donald) (ch. 1,360-2,355) |
17,792 |
17,792 |
|
|
|
|
|
|
17,792 |
||||||||
|
South Boundary Road (Birchip) (ch. 3140 - 7,925) |
125,876 |
125,876 |
|
|
|
|
|
|
125,876 |
||||||||
|
Farrells Road (Watchupga) (ch. 4,025 - 5235) |
34,998 |
34,998 |
|
|
|
|
|
34,998 |
|||||||||
|
Spicers Road (Birchip) (ch. 0.0 - 3,416) |
92,062 |
92,062 |
|
|
|
|
|
92,062 |
|||||||||
|
Gormons Road (Sea Lake) (ch.0.0 - 1.990) |
62,307 |
62,307 |
|
|
|
|
|
62,307 |
|||||||||
|
|
|
|
|
|
|
|
|||||||||||
|
Roads - Shoulder Resheets |
|
|
|
|
|
|
|
|
|||||||||
|
Culgoa Lalbert Road (Culgoa) (ch. 15,400-16,200) |
25,500 |
25,500 |
|
|
|
|
|
25,500 |
|||||||||
|
Nullawil Lalbert Road (Nullawil) (ch. 2,735-6,655) |
95,706 |
95,706 |
|
|
|
|
|
95,706 |
|||||||||
|
Wilkur Watchupga Road (Birchip) (ch. 26755-31,019) |
84,421 |
84,421 |
|
|
|
|
|
84,421 |
|||||||||
|
Sheephills Road (Donald) (Tysons Rd - Davidsons Rd) |
132,599 |
132,599 |
|
|
|
|
|
|
132,599 |
||||||||
|
Berriwillock - Woomelang Road (Berriwillock) (ch. 12330 - 28875) |
357,600 |
357,600 |
|
|
|
|
|
|
357,600 |
||||||||
|
|
|
|
|
|
|
|
|
|
|
||||||||
|
Footpaths |
|
|
|
|
|
|
|
|
|
||||||||
|
Howard Ln, Sea Lake (45m) Apex Park Toilets |
8,000 |
8,000 |
|
|
|
|
|
|
8,000 |
||||||||
|
Mudge St, Sea Lake (298m) Kinda to Hannon st |
52,000 |
52,000 |
|
|
|
|
|
|
52,000 |
||||||||
|
Lewis St, Donald |
22,000 |
22,000 |
|
|
|
|
|
|
22,000 |
||||||||
|
Broadway West, Wycheproof (70m) |
12,000 |
12,000 |
|
|
|
|
|
|
12,000 |
||||||||
|
|
|
|
|
|
|
|
|
|
|
||||||||
|
Kerb and Channel |
|
|
|
|
|
|
|
|
|
||||||||
|
Broadway, Wycheproof (135m) - Corack St to Elders |
50,000 |
50,000 |
|
|
|
|
|
|
50,000 |
||||||||
|
Hoban St Watchem (125m) P/O to Park |
37,500 |
37,500 |
|
|
|
|
|
|
37,500 |
||||||||
|
|
FUNDING SOURCE |
|||||||||
|
ASSET DESCRIPTION |
TOTAL |
RENEWAL |
UPGRADE |
NEW |
EXPANSION |
|
GRANTS |
|
COUNCIL FUNDS |
|
|
COMMUNITY CONTRIBUTION |
||||||||||
|
|
$ |
$ |
$ |
$ |
|
|
$ |
$ |
$ |
|
|
|
|
|
|
|
|
|
|
|
|
|
|
Bridges, Culverts, Pumps and Drainage |
|
|
|
|
|
|
|
|
|
|
|
Charlton Stormwater Re-use Upgrade |
85,000 |
|
85,000 |
|
|
|
|
|
85,000 |
|
|
Watchupga Culgoa Bridge |
400,000 |
400,000 |
|
|
|
|
|
|
400,000 |
|
|
|
|
|
|
|
|
|
|
|
|
|
|
Waste Management |
|
|
|
|
|
|
|
|
|
|
|
New Landfill Cells (annual) |
75,000 |
|
|
75,000 |
|
|
|
|
75,000 |
|
|
Landfill Rehabilitation (annual) |
50,000 |
50,000 |
|
|
|
|
|
|
50,000 |
|
|
Wycheproof Transfer Station- Develop Plans (stage 1) |
25,000 |
|
25,000 |
|
|
|
|
|
25,000 |
|
|
Landfill Access Track Upgrades |
20,000 |
20,000 |
|
|
|
|
|
|
20,000 |
|
|
Charlton Landfill fence upgrade (stage 2) |
20,000 |
20,000 |
|
|
|
|
|
|
20,000 |
|
|
|
|
|
|
|
|
|
|
|
|
|
|
Saleyards |
|
|
|
|
|
|
|
|
|
|
|
Upgrade Ramps |
25,000 |
25,000 |
|
|
|
|
|
|
45,000 |
|
|
Saleyard Kitchen Upgrade |
20,000 |
20,000 |
20,000 |
|||||||
|
Fence and gate renewal |
35,000 |
35,000 |
|
|
|
|
|
|
35,000 |
|
|
Sprinkler upgrade |
6,000 |
6,000 |
|
|
|
|
|
|
6,000 |
|
|
Saleyards and Truck wash Signage upgrade |
7,500 |
7,500 |
|
|
|
|
|
|
7,500 |
|
|
Killing yard fence extension |
2,500 |
2,500 |
|
|
|
|
|
|
2,500 |
|
|
Gravel kiosk area |
2,500 |
2,500 |
|
|
|
|
|
|
2,500 |
|
|
|
|
|
|
|
|
|
|
|
||
|
Aerodromes |
|
|
|
|
|
|
|
|
|
|
|
Gable markers and cone replacement |
10,000 |
10,000 |
|
|
|
|
|
|
10,000 |
|
|
|
FUNDING SOURCE |
||||||||
|
ASSET DESCRIPTION |
TOTAL |
RENEWAL |
UPGRADE |
NEW |
EXPANSION |
|
GRANTS |
|
COUNCIL FUNDS |
|
COMMUNITY CONTRIBUTION |
|||||||||
|
|
$ |
$ |
$ |
$ |
|
|
$ |
$ |
$ |
|
|
|
|
|
|
|
|
|
|
|
|
Other |
|
|
|
|
|
|
|
|
|
|
Gravel Pit Restoration |
25,000 |
25,000 |
|
|
|
|
|
|
25,000 |
|
Charlton Flood Study - Levee Detailed Design |
250,000 |
|
|
250,000 |
|
|
225,000 |
|
25,000 |
|
Charlton Flood Study - St Arnaud Road Floodway |
500,000 |
|
|
500,000 |
|
|
500,000 |
|
0 |
|
Donald Flood Study - Levee Development stage 1. |
925,000 |
|
|
925,000 |
|
|
832,500 |
|
92,500 |
|
Watchem Township Signs |
3,000 |
3,000 |
|
|
|
|
|
|
3,000 |
|
Shire Entrance signs |
7,500 |
7,500 |
|
|
|
|
|
|
7,500 |
|
|
|
|
|
|
|
|
|
|
|
|
|
|
|
|
|
|
|
|
|
|
|
Sub-Total - Infrastructure |
4,169,685 |
2,309,685 |
110,000 |
1,750,000 |
|
|
3,557,500 |
0 |
612,185 |
|
|
|
||||||||
|
GRAND TOTAL NEW WORKS |
5,898,847 |
3,816,685 |
165,000 |
1,917,162 |
0 |
|
4,419,242 |
22,000 |
1,457,605 |
|
|
|
||||||||
|
|
|
|
|
|
|
|
|
|
|
|
WORKS CARRIED FORWARD FROM 2013/14 |
|
|
|
|
|
|
|
|
|
|
Community Facilities |
|
|
|
|
|
|
|
|
|
|
|
|
|
|
|
|
|
|
|
|
|
Donald Family Services Centre |
1,490,600 |
|
1,490,600 |
|
|
|
1,371,000 |
|
119,600 |
|
Birchip Bowling Green Redevelopment |
240,000 |
240,000 |
240,000 |
||||||
|
Charlton Park 2020 Design Services |
25,000 |
25,000 |
25,000 |
||||||
|
Charlton Skate Park |
100,000 |
|
100,000 |
|
|
60,000 |
|
40,000 |
|
|
Wycheproof Centenary Park Shade Structure |
28,000 |
28,000 |
|
|
|
|
|
|
28,000 |
|
|
|
|
|
|
|
|
|
|
|
|
Sub-Total - Carried Forward from 2013/14 |
1,883,600 |
268,000 |
1,490,600 |
125,000 |
0 |
|
1,696,000 |
0 |
187,600 |
|
|
|
||||||||
|
GRAND TOTAL ALL WORKS |
7,782,447 |
4,084,685 |
1,655,600 |
2,042,162 |
0 |
|
6,115,242 |
22,000 |
1,645,205 |
Buloke Shire Council Special Meeting Wednesday, 25 June 2014
5.1.1 Adoption of Budget for Municipal Year Ending 30 June 2015
Attachment 1 Draft 2014-15 Budget for Adoption
Appendix D
Fees and charges schedule
This appendix presents the fees and charges of a statutory and non-statutory nature which will be charged in respect to various goods and services provided during the 2014/15 year.
VENUE HIRE - PUBLIC HALLS
No increase in fees for 2014/15
Events or Groups defined by the following categories
will be eligible to have hire fees waived:
· Ceremonies held in recognition of Australia Day or Anzac Day.
· Community Groups - community based non- for-profit organisation or association of persons where open membership and participation in activities is encouraged. A community group may take part in profit-making activities, but the surplus is reinvested in pursuit of the group’s goals. A community group may be:
o An organisation whose primary aim is to provide services and benefits to the community (e.g. Lions Clubs, Community forums, Business Networks, Schools, Health Related services and Sporting Clubs)
o Special interest or advocacy groups for particular sections of the community (e.g. Senior Citizens, Probus, Red Cross). This does not include political parties or groups
o A group of people having a shared ethnic, cultural or religious identity
o Neighbourhood or shared interest groups
|
(Casual hire) |
Main Hall (max. 6 hours) |
Supper Room (max. 6 hours) |
Cost p/h (over max. hours) |
Kitchen |
All day booking (24 hours, full use of venue) |
Bond |
|
Birchip (max. 250 people) |
$200.00 |
$50.00 |
$35.00 |
$30.00 |
$350.00 |
$300.00 |
|
Charlton (max. 300 people) |
$200.00 |
$50.00 |
$35.00 |
$30.00 |
$350.00 |
$300.00 |
|
Donald (max. 250 people) |
$200.00 |
$50.00 |
$35.00 |
$30.00 |
$350.00 |
$300.00 |
|
Wycheproof (max. 250 people) |
$200.00 |
$125.00 |
$35.00 |
$30.00 |
$350.00 |
$350.00* |
A Bond is required for all
bookings where alcohol is served. The Bond is refundable if there is no damage
or requirement for additional cleaning.
*Inspections will be
carried out by Buloke Shire Council’s Hall Attendant.
Casual Hire is defined as: Any group, individual or organisation that hires the facility once off or on an irregular basis.
SENIOR CITIZENS
|
Clubrooms
|
Charlton |
Donald |
Wycheproof |
|
Max. 6 hours |
$85.00 |
$100.00 |
$50.00 |
|
Cost per hour over max. |
$20.00 |
$20.00 |
$20.00 |
|
Regular Hire
|
|
|
Private or Commercial |
$30.00 |
Regular Hire: Any group,
individual or organisation that hires the facility on an ongoing basis. To be
considered a Regular User, one of the following criteria must be met:
· Weekly hire - minimum of 10 consecutive weeks,
· Fortnightly hire - minimum of 10 consecutive fortnights,
· Monthly hire - minimum of 10 consecutive months
Commercial hirers: Those who undertake activities for the purpose of generating
a profit.
Private/Individual hirers: Those who undertake activities for the purpose of
private events and activities.
WYCHEPROOF SALEYARDS
|
|
|
|
|
Wycheproof Saleyards |
2013/2014 |
2014/2015 |
|
|
|
|
|
Yard Fees |
0.6% of gross sales turnover |
0.8% of gross sales turnover |
|
Agent's Fees |
12% of yard fees |
13% of yard fees |
|
Truck Wash |
$24.00 |
$25.00 |
|
Key Deposit (Avdata) Refunded on return of keys |
||
|
Water Usage |
$0.80 per minute |
$0.80 per minute |
COMMUNITY BUS HIRE
|
Bus Fees |
2013/2014 |
2014/2015
|
|
Hire rate per day or part thereof |
$14.00 |
$14.00 |
|
Plus 90 cents per kilometre travelled |
$0.90 |
$0.90 |
STAND PIPES
|
Stand Pipes |
2013/2014
|
2014/15 |
|
|
$5.00 per 1,000 litres or part there of |
$10.00 per 1,000 litres or part there of |
ANIMAL CONTROL
|
Dog and Cat Registration Fees *Since May 2007 Council can only register animals that have been micro chipped |
2013/2014 |
2014/2015
|
|
Dog or Cat (Not Micro chipped or Desexed – only relevant to animals registered prior to May 2007) |
$60.00 |
$90.00 |
|
Dogs (Micro chipped plus one or more of the following – desexed, not desexed, working or farm dog, over 10 years old or VCA members) |
$20.00 |
$30.00 |
|
Cats (Micro chipped plus one or more of the following – desexed, not desexed, over 10 years old or Feline Association member) |
$20.00 |
$30.00 |
|
Pensioner Concession (Half price for all dog and cat registration categories) |
$10.00 |
$15.00 |
|
Guide dogs, racing dogs (greyhounds), police dogs |
No charge |
No charge |
|
Replacement lifetime tag/s |
No charge |
No charge |
|
Registered animals moving to Buloke |
No charge |
No charge |
IMPOUNDED LIVESTOCK
|
Release Fees |
2013/2014 |
2014/2015
|
|
Sheep up to 5 head |
$30.00 |
$30.00 |
|
Sheep per head over 5 |
$5.00 |
$5.00 |
|
Goats and pigs up to 2 head |
$30.00 |
$30.00 |
|
Goats and pigs per head over 2 |
$10.00 |
$10.00 |
|
Cattle up to 3 head |
$100.00 |
$100.00 |
|
Cattle per head over 3 |
$50.00 |
$50.00 |
|
Horses per head |
$100.00 |
$100.00 |
|
Sustenance – per day – per head |
2013/2014 |
2014/2015
|
|
Sheep |
$5.00 |
$5.00 |
|
Goats and Pigs |
$10.00 |
$10.00 |
|
Cattle and Horses |
$10.00 |
$10.00 |
|
Dogs and Cats (includes sustenance) – per dog and cat |
2013/2014 |
2014/2015
|
|
1 to 4 days |
$55.00 |
$60.00 |
|
For every day in excess of 4 days (maximum 8 days) |
$11.00 |
$12.00 |
|
Impounded Vehicles and Caravans – per vehicle |
2013/2014 |
2014/2015
|
|
Release fee (plus towing fee incurred) |
$153.00 |
$175.00 |
|
Impounded Goods – including signage and street furniture - per lot |
2013/2014 |
2014/2015
|
|
Release fee (plus any associated costs) |
No charge |
$175.00 |
SUNDRY DEBTORS
|
Hire of Council equipment and operator where local service alternatives are not available. |
2013/2014 |
2014/2015
|
|
Plant |
150% of internal plant hire rate |
150% of internal plant hire rate |
|
Operator (Labour) |
$50.00 per hour plus plant fee – as above |
$50.00 per hour plus plant fee – as above |
|
Sandstone/Gravel from Council quarry |
$10.00 per cubic metre |
$10.00 per cubic metre |
|
Quarry products from non-Council quarry sources |
Cost to Council plus plant and operator costs – as above. |
Cost to Council plus plant and operator costs – as above. |
WASTE CHARGES
|
Waste |
2013/2014 |
2014/2015
|
|
Municipal Waste Collection and Disposal Charge (One 120L bin for putrescibles waste (collected weekly) and one 240L bin for recyclables (collected fortnightly). Service is compulsory for all residential properties and available to commercial and farm properties on request. |
$255.00 |
$380.00 |
|
Optional additional 240L bin for recycling |
$75.00 per bin |
$80.00 |
|
Landfill |
2013/2014 |
2014/2015
|
|
Up to 3 cubic metres of sorted recyclables, uncontaminated green waste, commercial cardboard. For larger volumes please contact Council to receive a quote. |
Free for local residents and businesses only |
Free for local residents and businesses only |
|
Car boot per load |
N/A |
$10.00 |
|
6 x 4 Trailer Load/Ute Load up to 1 cubic metre |
$17.00 |
$19.00 |
|
Tandem Trailer up to 2 cubic metres |
$34.00 |
$36.00 |
|
Wheelie bin 120L |
$5.00 |
$6.00 |
|
Wheelie bin 240L |
$5.00 |
$8.00 |
|
General Waste to Landfill per cubic metre |
$17.00 |
$19.00 |
|
Commercial Waste |
$17.00 per cubic m |
$19.00 per cubic m |
|
Builder Waste and Concrete |
$17.00 per cubic m |
$19.00 per cubic m |
|
Concrete uncontaminated |
$17.00 per cubic m |
$19.00 per cubic m |
|
Bricks uncontaminated |
$17.00 per cubic m |
$19.00 per cubic m |
|
White Goods (doors must be removed from refrigerators, ovens and dishwashers) |
Free to local residents only |
Free to local residents only |
|
Car Bodies |
Free to local residents only |
Free to local residents only |
|
TV Screens and Computer Monitors |
$10.00 |
$10.00 |
|
Mattresses |
$25.00 |
$30.00 |
|
Tyres |
2013/2014 |
2014/2015
|
|
Light car tyre |
$5.00 |
$6.00 |
|
Car tyre on rim |
$20.00 |
$20.00 |
|
4WD and Light Truck tyre |
$10.00 |
$10.00 |
|
Truck tyre |
$25.00 |
$25.00 |
|
Super single tyre |
N/A |
N/A |
|
Truck tyre on rim |
$40.00 |
$40.00 |
|
Small tractor tyres |
$80.00 |
$80.00 |
|
Large tractor tyres |
$140.00 |
$140.00 |
|
Animal Carcasses |
2013/2014 |
2014/2015
|
|
Poultry (including turkeys) per bird |
$5.00 |
$5.00 |
|
Cats and Dogs |
$5.00 |
$5.00 |
|
Sheep, Pigs and Goats |
$10.00 |
$10.00 |
|
Horses and Cattle |
$20.00 |
$20.00 |
SWIMMING POOL FEES
|
Season Membership |
2013/2014 |
2014/2015
|
|
All fees |
No charge |
No charge |
BUILDING FEES AND CHARGES
|
Dwellings |
2013/2014 |
2014/2015 |
|
Building Works - $0 to $2,500 |
$250.00 |
$250.00 |
|
Building Works - $2,501 to $5,000 |
$350.00 |
$350.00 |
|
Building Works - $5,000 to $10,000 |
$450.00 |
$450.00 |
|
Building Works - $10,001 to $20,000 |
$650.00 plus Levy |
$650.00 plus Levy |
|
Building Works - $20,001 to $80,000 |
$950.00 plus Levy |
$950.00 plus Levy |
|
Building Works - $80,001 to $120,000 |
$1,500.00 plus Levy |
$1,500.00 plus Levy |
|
Building Works - $120,001 to $200,000 |
$value /75 plus Levy |
$value /75 plus Levy |
|
Building Works - $200,000 plus |
$value /75 plus Levy |
$value /75 plus Levy |
|
Alterations/Additions/Sheds/Carports/Garages |
2013/2014 |
2014/2015 |
|
New Dwellings - $0 to $120,000 |
$1,200.00 plus Levy |
$1,200.00 plus Levy |
|
New Dwellings - $120,000 to $200,000 |
$1,500.00 plus Levy |
$1,500.00 plus Levy |
|
New Dwellings - $200,000 to $312,000 |
$1,800.00 plus Levy |
$1,800.00 plus Levy |
|
New Dwellings - $312,000 plus |
$value /130 plus Levy |
$value /130 plus Levy |
|
Swimming Pools |
2013/2014 |
2014/2015 |
|
Swimming Pool and Fence – Above Ground |
$400.00 |
$400.00 |
|
Swimming Pool and Fence – In-Ground Pool |
$800.00 |
$800.00 |
Notes:
A $34.00 Lodgement Fee applies to all application for works valued at $5,000 or more.
2014/2015 Fee proposals have been based on fee structure of surrounding Councils.
No fee details’ comment indicates that fees for these services were previously set at the discretion of the Building Surveyor.
|
Commercial Building Work |
2013/2014 |
2014/2015 |
|
Commercial Works - $0 to $10,000 |
$350.00 plus Levy |
$350.00 plus Levy |
|
Commercial Works - $10,001 to $20,000 |
$650.00 plus Levy |
$650.00 plus Levy |
|
Commercial Works - $20,001 to $100,000 |
$value x 1.33% plus $400 plus Levy |
$value x 1.33% plus $400 plus Levy |
|
Commercial Works - $100,001 to $500,000 |
$value x 0.44&% plus $1,200 plus Levy |
$value x 0.44&% plus $1,200 plus Levy |
|
Commercial Works - $500,000+ |
$value x 0.25% plus $2,000 plus Levy |
$value x 0.25% plus $2,000 plus Levy |
|
Multi-Unit Development |
2013/2014 |
2014/2015 |
|
Units - $0 to $200,000 |
$1,800.00 plus Levy |
$1,800.00 plus Levy |
|
Units - $200,001 to $312,000 |
$2,000.00 plus Levy |
$2,000.00 plus Levy |
|
Units - $312,000+ |
$value/130 plus Levy |
$value/130 plus Levy |
|
Enforcement |
2013/2014 |
2014/2015 |
|
Building Notices/Orders (To allow buildings to remain as constructed, without a Building Permit) |
Building Permit Fee plus 25% |
Building Permit Fee plus 25% |
|
Miscellaneous Items |
2013/2014 |
2014/2015 |
|
Fence |
$200.00 |
$200.00 |
|
Demolitions or Removals - $0 to $5,000 |
$350.00 |
$350.00 |
|
Demolitions or Removals - $5,000+ |
$500.00 |
$500.00 |
|
Re-Erections of Dwellings – Security Deposit |
$5,000.00 |
$5,000.00 |
|
Extensions of Time Requests |
$100.00 |
$100.00 |
|
Amended Plans |
$100.00 |
$100.00 |
|
Information Request Reg. 326 (1) Permit Info, Final Certifications, Current Orders or Notices |
Legislative fee |
Legislative fee |
|
Information Request Reg. 326 (2) Flooding, Termite, Bushfire, Snowfall, Designated |
Legislative fee |
Legislative fee |
|
Information Request Reg. 326 (3) Mandatory notification states, Inspection Dates |
Legislative fee |
Legislative fee |
|
Request for search of Building Permit Plans |
$60.00 |
$60.00 |
|
Report and Consent |
2013/2014 |
2014/2015 |
|
Planning Authority for Demolition Section 29A of the Act |
Legislative fee |
Legislative fee |
|
Build Over Council Easement Reg. 310 (1) |
Legislative fee |
Legislative fee |
|
Report & Consent under Parts 4, 5 or 8 |
Legislative fee |
Legislative fee |
|
Request Legal Point of Discharge for Stormwater Reg. 610 (2) |
Legislative fee |
Legislative fee |
|
External Inspection (i.e. Private Building Surveyors) |
2013/2014 |
2013/2014 |
|
Additional Inspection |
$120.00 |
$120.00 |
|
Contract Inspection – Foundations, Reinforcement and Finals |
$180.00 |
$180.00 |
|
Contract Inspection – Frame |
$200.00 |
$200.00 |
|
Occupancy Permit/Places of Public Entertainment |
$200.00 |
$200.00 |
|
Travel Time and Vehicle Costs – (where more than 5km from Donald Office) |
$1.00 per km plus $75.00 per hour |
$1.00 per km plus $75.00 per hour |
|
Government Levy (only applies if development value over $10,000) |
2013/2014 |
2014/2015 |
|
Additional Inspection |
$120.00 |
$120.00 |
Notes:
® A $34.00 Lodgement Fee applies to all application for works valued at $5,000 or more.
® 2014/2015 Fee proposals have been based on fee structure of surrounding Councils.
® No fee details’
comment indicates that fees for these services were previously set at the
discretion
of the Building Surveyor.
ENVIRONMENTAL HEALTH
|
Food Act |
2013/2014 |
2014/2015 |
|
Class 1 Food Premises – High Risk ready to eat food serves to vulnerable groups. Including hospitals, nursing homes, child care centres. Must have 3rd party audited FSP. |
$250.00 |
$300.00 |
|
Class 2 Food Premises – High Risk or unpackaged foods. Including hotels, restaurants cafes, takeaway, supermarkets, manufacturers, caterers, milk bars and some service stations. Must have FSPI (may be template or 3rd Party audited) |
$200.00 |
$250.00 |
|
Class 3 Food Premises – Premises selling low risk pre-packaged food only e.g. Packaged confectionary, soft drink, Newsagents, video stores, some service stations. |
$50.00 |
$80.00 |
|
Non Profit Organisations & Community Groups – Food is prepared predominately for consumption by members, or for fundraising activities Service Clubs, mostly Sporting Clubs |
$20.00 |
$20.00 |
|
Street Stalls/Temporary Food Vendor Permits; Non Profit & Community Groups (fetes, sausage sizzle, street stall) Single Event Permit Yearly Permit (up to 12 Events per year) Private Individuals & Businesses (Markets, Private Stalls) Single Event Permit Yearly Permit (up to 12 Events per year) |
$20.00 $20.00
$20.00 $40.00 |
$20.00 $20.00
$20.00 $40.00 |
Transfers Fees |
50% of the current classed fee both Food & Health Act |
50% of the current classed fee both |
|
Transfer Inspection Fee |
$75.00 |
$75.00 |
|
Public Health and Wellbeing Act |
2013/2014 |
2014/2015 |
|
Hairdresser/Beauty Therapy /Skin Penetration |
$80.00 |
$100.00 |
|
Prescribed Accommodation Premises providing accommodation for 5 or more persons including hotels, motels, hostels and camps. |
$80.00 |
$100.00 |
|
Environmental Protection Act |
2013/2014 |
2014/2015 |
|
Septic Tank ® New ® Alteration to Existing |
$200.00 $150.00 |
$220.00 $150.00 |
AGED AND DISABILITY SERVICES
|
Home and Community Care (HACC) |
2013/2014 |
2014/2015 |
|
HACC General Home Care A |
$2.00 |
$2.00 |
|
HACC General Home Care |
$5.50 |
$6.00 |
|
HACC General Home Care B |
$7.00 |
$7.00 |
|
HACC General Home Care C |
$10.00 |
$10.00 |
|
HACC General Home Care D |
No charge |
No charge |
|
HACC General Home Care E |
$1.00 |
$1.00 |
|
Home Maintenance |
$9.00 |
$10.00 |
|
Home Maintenance A |
$5.00 |
$5.00 |
|
Home Maintenance B |
No charge |
No charge |
|
Materials supplied |
$10/$15/$20 |
$10/$15/$20 |
|
HACC Personal Care |
$4.50 |
$4.50 |
|
HACC Personal Care A |
$1.00 |
$1.00 |
|
HACC Personal Care B |
No charge |
No charge |
|
HACC Respite Care HIGH |
$3.50 |
$4.00 |
|
HACC Respite Care HIGH A |
$1.00 |
$1.00 |
|
HACC Respite Care HIGH B |
No charge |
No charge |
|
HACC Respite Care LOW |
$3.50 |
$3.50 |
|
HACC Respite Care LOW A |
$1.00 |
$1.00 |
|
HACC Respite Care LOW B |
No charge |
No charge |
|
HACC Meals on Wheels |
$7.50 |
$8.50 |
|
HACC Meals on Wheels A |
$3.50 |
$3.50 |
|
HACC Meals on Wheels B |
No charge |
No charge |
|
Meals on Wheels $11 (Full cost recovery) |
$11.00 |
$11.00 |
|
Brokerage |
2013/2014 |
2014/2015 |
|
General Home Care |
$45.10 |
$55.00 |
|
Personal Care |
$45.10 |
$55.00 |
|
Home Maintenance |
$45.10 |
$55.00 |
|
Respite Care LOW |
$45.10 |
$55.00 |
|
Respite Care HIGH |
$45.10 |
$55.00 |
|
Travel |
0.97 |
$2.00 |
|
All weekend services |
No charge |
$110.00 |
|
To complete OH & S Assessment for packaged care client |
No charge |
$120.00 |
|
To complete a MEPACS/PAV Assessment – personal security alarm for packaged care client |
No charge |
$120.00 |
|
MEPACS Referral |
- |
$50.00 |
Buloke Shire Council Special Meeting Wednesday, 25 June 2014
5.1.1 Adoption of Budget for Municipal Year Ending 30 June 2015
Attachment 1 Draft 2014-15 Budget for Adoption
Appendix E
Service Review Outcomes
This appendix presents summary information regarding the service reviews undertaken by Council in the preparation of the 2014/15 Budget and Strategic resource Plan. The review outcomes have been incorporated in the 2014/15 Budget and Strategic Resource Plan.
|
Service |
Savings Budget 2014/15 $’000 |
Savings 2015/16 SRP $’000 |
|
Aged and Disability Services |
|
|
|
This service provides a range of maintenance and support services to assist frail older people and younger people with a disability to live independently at home. Council's service provides domestic assistance, personal care, respite care, home maintenance, meals services, volunteer coordination, aged transport, aged accommodation and senior citizens centres. |
|
|
|
The cost of the service is to be capped to current levels with service delivery efficiencies implemented over the 2014/15 financial year. |
|
150 |
|
The current community transport services, which include taxi subsidy in Wycheproof, volunteer transport and community bus will not be continued when the vehicles are no longer fit for purpose. |
|
30 |
|
|
|
|
|
Assets & Project Management |
|
|
|
This service is to provide for the management, design and administration of Council's assets and infrastructure services, including planning and management of the capital works program. |
|
|
|
No change in service proposed |
|
|
|
|
|
|
|
Property Plant & Equipment (Asset Rationalisation) |
|
|
|
Council have a range of assets which include property, buildings and plant which support the operation of council |
|
|
|
Council will continually review properties and implement a rationalisation program. A reduction in light fleet will be implemented in 2014/15. Sale of properties will be realised in 2015/16. The sale of large plant (graders) will also proceed with savings identified in the road services. |
50 |
100 |
|
|
|
|
|
Community Support |
|
|
|
The service develops links between and within the communities in the Shire and works with local communities and groups to access community projects recognised as community priorities and provides a range of youth services that support young people aged between 12 and 25. The service also facilitates economic development throughout the Shire and provides support to local businesses and assists in the promotion of tourism. |
|
|
|
Rationalisation of community support program which includes youth and economic development to council funding of 1.5EFT is aimed at targeting government funded programs. |
90 |
230 |
|
|
|
|
|
Customer Service |
|
|
|
This service provides for both internal and external customers by resolving the majority of customer enquiries, requests and payments at the first point of contact. |
|
|
|
Rationalisation of the Customer service provision by increasing access for all financial transactions at Post Office outlets and closing the public access at four of council District Offices. |
|
380 |
|
|
|
|
|
Early Years |
|
|
|
This service is to advocate for the wellbeing of children and their families and ensure it is supported through planning and service development. The service provides pre-school services in 5 towns, maternal and child health and support for playgroups run by parents |
|
|
|
The majority of costs of this service relate to building maintenance. No change in service proposed. |
|
|
|
Service |
Savings Budget 2014/15 $’000 |
Savings 2015/16 SRP $’000 |
|
Environmental Health |
|
|
|
This service promotes the health and well-being of the Shire’s local communities through a range of Public Health Programs including immunisations, food surveillance and registration of food premises, accommodation standards and waste water management |
|
|
|
This service is a statutory service. No Change in service proposed. |
|
|
|
|
|
|
|
Environmental Planning |
|
|
|
This service manages Council's Environmental Compliance and Sustainability Programs and Services. |
|
|
|
Council has a range of Statutory obligations for environmental compliance. No change in service proposed. |
|
|
|
|
|
|
|
Governance & Executive Management |
|
|
|
This service provides for Councillors, and Executive Support and associated support which provides the overall Governance Services to the Council. |
|
|
|
No change in service proposed. |
|
|
|
|
|
|
|
Information Management |
|
|
|
This service is to provide the organisation with Records Management Services and Information and Telecommunications Services. |
|
|
|
No change in service proposed. |
|
|
|
|
|
|
|
Lakes |
|
|
|
This service provides a contribution to the management and development of the Recreational Lakes including Tchum, Green, Wooroonook, Watchem & Folletti Lakes. |
|
|
|
Councils will continue to support lakes with cleaning and litter collection. Contribution to water costs will not be included for funding in the 2014/15 budget, however GWM Water will take over subsidising local lake committees of the water cost by over 50% through the new Recreation Contribution Charge. |
55 |
55 |
|
|
|
|
|
Library Services |
|
|
|
This service provides mobile library services to the townships of Birchip (co-located with Birchip school), Charlton, Donald, Watchem, Berriwillock , Sea Lake, Culgoa, Nullawil and Wycheproof. |
|
|
|
Review service levels and provisions when library agreements are due for renewal |
|
|
|
|
|
|
|
Municipal Emergency Management |
|
|
|
This service develops, coordinates and delivers Council’s Municipal Emergency Management Plan and coordination of MECC Centre and associated software. |
|
|
|
In collaboration with emergency services agencies, Council will complete a full review and implementation of a new Municipal Emergency Management Plan and commence reviews on emergency sub-plans.
|
|
|
|
Service |
Savings Budget 2014/15 $’000 |
Savings 2015/16 SRP $’000 |
|
Procurement |
|
|
|
This service reviews and implements all business processes associated with purchasing, contracting and the tendering services and to manage Council's light fleet and community buses. |
|
|
|
Improved efficiencies in the provision of procurement services to provide the service with 2.5EFT. |
70 |
150 |
|
|
|
|
|
Property Maintenance |
|
|
|
This service is to provide Property Maintenance Services to a range of Council's building-based assets, focussing on the upkeep and renewal of buildings. |
|
|
|
Improvement to Community Halls with a range of upgrade works to kitchens, heating and cooling. Council will also improve the community access to our Halls by removing the fees charged to community groups |
|
|
|
|
|
|
|
Recreation Services |
|
|
|
This service provides recreational facilities and support to community run recreation reserves in 9 towns across the Shire, as well as governance support to community recreation clubs and committees |
|
|
|
Council continue support for recreation reserves across the shire. This will provide Recreation Maintenance Allocations to 9 townships, provided directly to the local communities. No change in service proposed. |
|
|
|
|
|
|
|
Road Services |
|
|
|
This service is to provide road maintenance for the 1100km of Sealed, 650km of Gravel and 3,800km of Earth roads across the Shire |
|
|
|
Rationalisation of our work crews with a reduction in grader crews from 6 to 4 combined with a program to upgrade and modernise councils outdoor plant fleet. This will be phased in over the 2014/15 financial year with the sale of 3 older graders and purchase of a new fully equipped grader. |
|
970 |
|
Implementation of councils road management plan which with new road classifications, reducing councils long term costs and roads depreciation |
556 |
556 |
|
|
|
|
|
Saleyards |
|
|
|
This service provides for the management and administration of the Council’s Saleyards Precinct at Wycheproof for external Livestock Agents to sell Livestock. |
|
|
|
Service to be cost neutral to council with fees and charges reflecting operating and capital costs. |
|
|
|
|
|
|
|
Community Grants |
|
|
|
This service provides donations, allocations and support to groups in the community that contribute to services that connect and involve the local area. |
|
|
|
Rationalisation of Councils community grants program to reduce the administrative burden on local community groups. Community groups will now be directly funded from the budget. |
|
|
|
|
|
|
|
Corporate Support |
|
|
|
This service provides donations, allocations and support to groups that will assists council to facilitate an environment that is conducive to a sustainable and growing local business sector and provides opportunities for local residents to improve their skill levels and access employment |
|
|
|
A review of corporate support for organisations which to focus on enhanced economic opportunities and advocate for community issues. |
30.5 |
30.5 |
|
Service |
Savings Budget 2014/15 $’000 |
Savings 2015/16 SRP $’000 |
|
Statutory Compliance & Strategic Planning |
|
|
|
The purpose of the Statutory and Compliance Service is to provide Statutory Planning, Building Services and Compliance and Local Laws services. |
|
|
|
Develop a Rural Land Use Strategy for the Buloke Planning Scheme that will plan for long term agricultural productivity alongside complimentary uses within rural zones.
|
|
|
|
Predominantly statutory & regulatory services. No change in service proposed |
|
|
|
|
|
|
|
Swimming Pools |
|
|
|
This service manages and operates seven seasonal swimming pools, from the third week in November to the third week in March, annually |
|
|
|
Continued delivery of seasonal swimming pools in 7 townships. Council to seek further partnerships with community groups to increase the accessibility to community pools. |
|
|
|
|
|
|
|
Urban Areas/Parks & Gardens |
|
|
|
This service manages and coordinates Council’s Parks & Gardens, Urban Infrastructure & Aerodromes providing routine, preventative and on-going maintenance and improvements. |
|
|
|
Rationalisation of resources in Urban Areas in Environment will be phased in over the 2014/15 financial year resulting in a 25% reduction in resource levels |
|
270 |
|
|
|
|
|
Waste & Environment |
|
|
|
Waste and Environment Services is responsible for the maintenance and improvement of Council’s landfills and transfer stations as well as providing a Residential Kerbside Garbage & Recycling service in all towns within the Shire. |
|
|
|
A review of all Council owned and/or operated gravel pits will be commenced in 2014/15 to ascertain the future planning and operation of these assets.
|
|
|
|
Council provide for full cost recovery for waste management and street cleaning services |
431 |
431 |
|
|
|
|
|
Total Budget Savings1) |
1,2822) |
3,3523) |
1)The budget savings identified have been included in Councils 2014/15 Budget and Strategic Resource Plan.
2)The budget savings for year one have been included in the financial statements in Councils 2014/15 Budget.
3)The budget savings identified in future years are inclusive of the savings included in the 2014/15 Budget and have been incorporated into the financial statements in the Strategic Resource Plan 2015/16 and beyond.
It is recognised that further savings of $648,000 (additional to the $3.352 million already identified) is required to be implemented to achieve a target of $4.0 million annual savings. A total saving of $4.0 million has been incorporated into the financial statements in the Strategic Resource Plan 2015/16 and beyond.
6. MEETING CLOSED
Meeting closed at 5.42pm.